by
by Are your competitors outpacing you on LinkedIn? Wondering how to find out what they’re doing to grow an audience?
In this article, you’ll discover how to use the upgraded LinkedIn competitor analytics dashboard to improve your business page content and strategy.

How LinkedIn Competitor Analytics Can Inform Your Marketing
For most social media marketers, reporting and analysis are critical parts of the job. In many cases, it makes sense to focus on your company page’s metrics. After all, taking steps like tracking key performance indicators (KPIs) and benchmarking current metrics against past results can help you measure progress and ensure you’re reaching goals.
Yet no business exists in a completely independent space. By using competitor analytics, you can add relevant context to your reporting and analysis. With added context, you can better understand how your business’ marketing campaigns are performing and get ideas for improving your social media strategy.
For example, your team may have set certain KPIs for the month, quarter, or year. Those goals may make sense given your team, budget, and other resources. But if they don’t allow you to compete successfully with other businesses in your space, those KPIs may not be optimal for your business.
With LinkedIn competitor analytics, you can ensure you’re setting relevant goals so your business can compete effectively. These LinkedIn analytics can also help you identify areas for improvement, ideas for content, and growth opportunities, all of which can enable your business to thrive on LinkedIn and beyond.
How to Use LinkedIn’s Competitor Analytics Dashboard for Company Pages
The LinkedIn competitive analysis dashboard is available on both desktop and mobile. The two interfaces provide different information so it’s helpful to include both in your LinkedIn competitor analysis.
On both mobile and desktop, you can access the dashboard by navigating to your company page, opening the Analytics tab, and locating the Competitors panel.
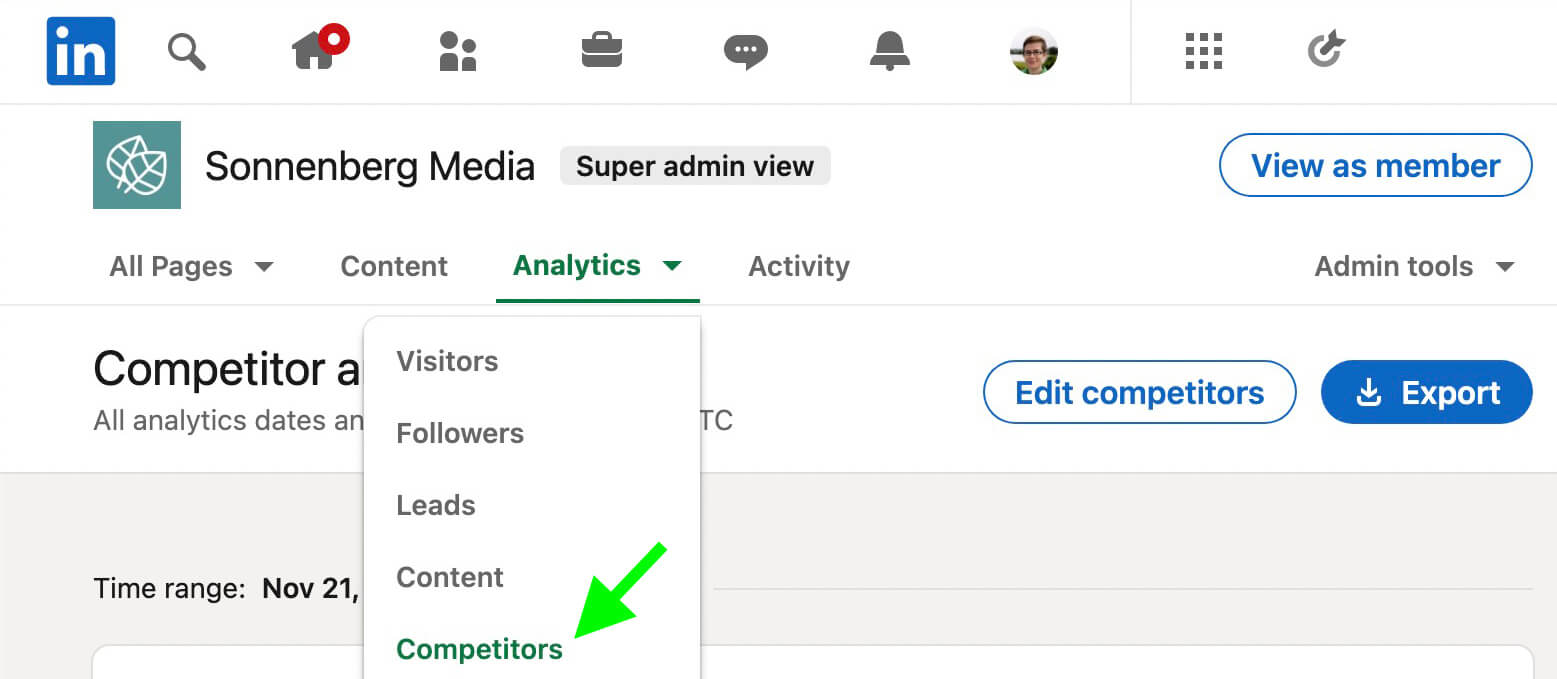
Let’s walk through how to use this dashboard and explore what you can learn from these insights.
#1: Choose Competitors to Follow
If you’re new to using the competitor analytics dashboard, start by adding relevant businesses to the dashboard. Use your list of direct competitors or work with your team to create a short list. Then use the dashboard to search for their company pages and add them to your list of competitors.
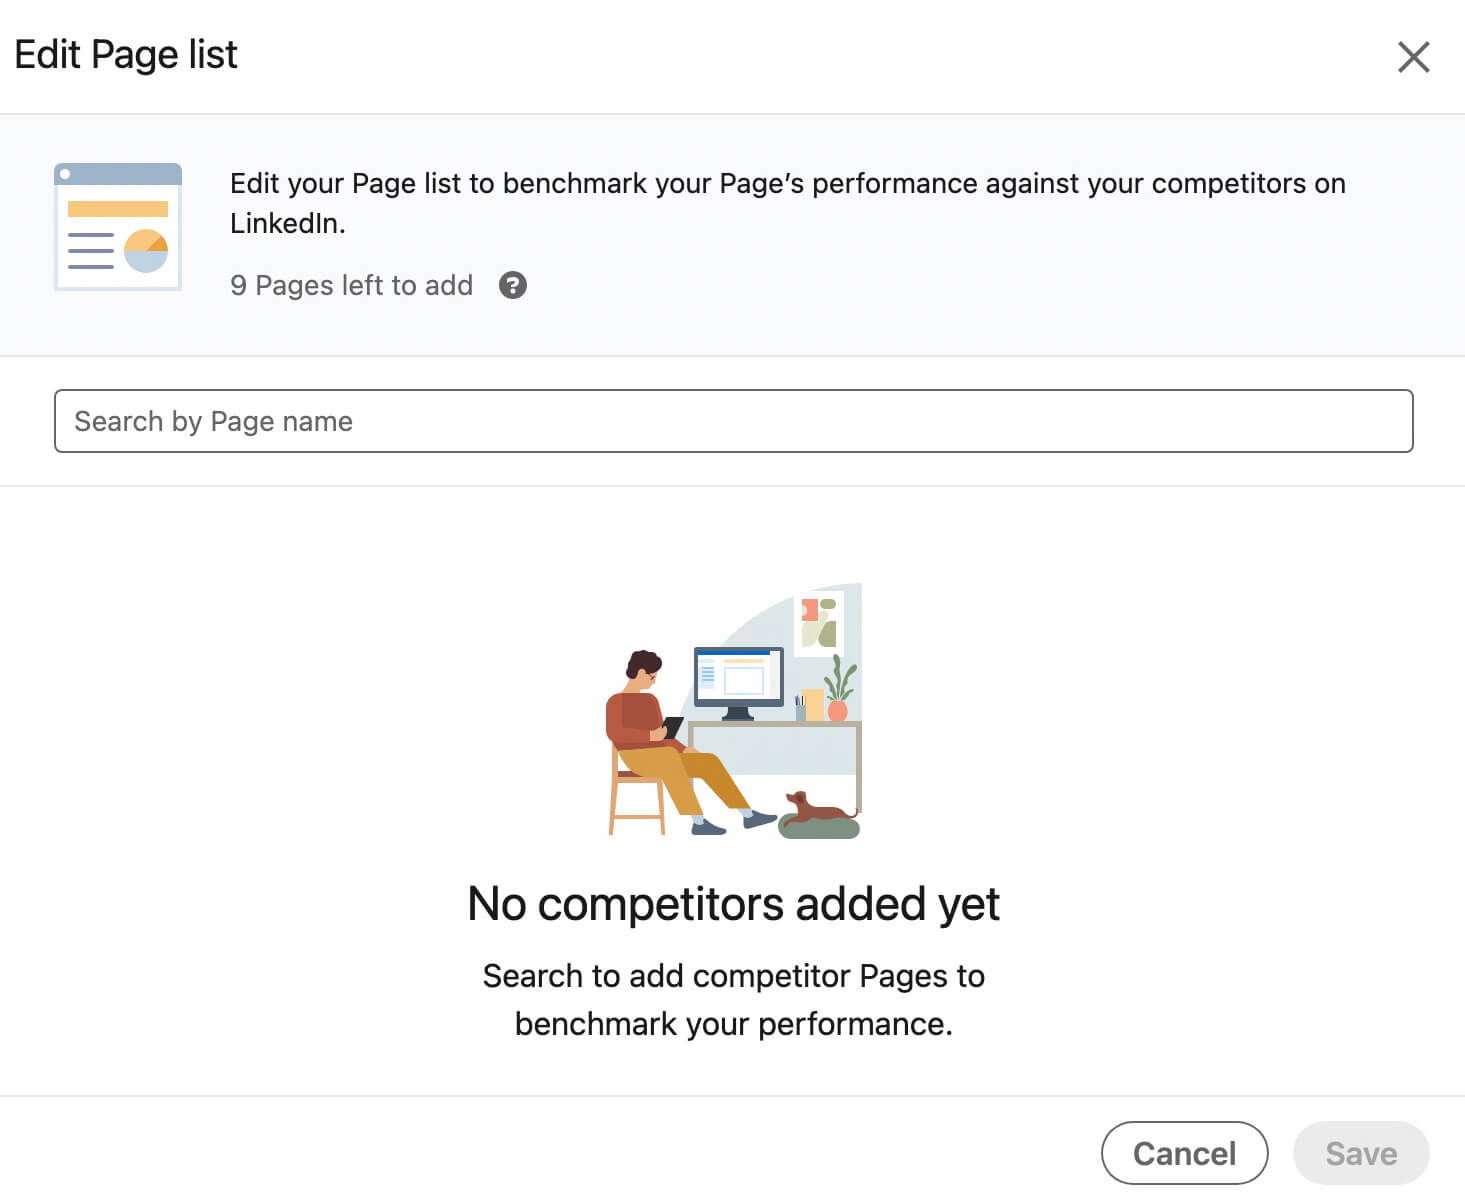
Although this dashboard is designed for direct competitors, you can opt to add a slightly different set of businesses instead. For example, if you’ve set ambitious growth goals for your business, you might use the dashboard to monitor organizations that are already at the next level so you can measure your page against more established companies.
If you’ve already added company pages to your competitor list, you can edit and update it at any time. LinkedIn currently allows you to benchmark your business against up to nine other company pages. LinkedIn automatically adds your company page to round out a list of 10 businesses.
Keep in mind that your competitor analytics dashboard is private to your team. Admins don’t get notified when you add their business to your dashboard and they won’t be able to tell that you’re comparing your company page to theirs.
It’s also important to note that unlike other platforms such as Meta Business Suite, LinkedIn doesn’t let you opt out of including your company page in these competitor analytics. That means any business can add your company page to their dashboard and compare your results to theirs.
Go Deeper Than an Article Can Take You

Join thousands of small-business marketers at Social Media Marketing World — three days of AI, social media, and marketing strategy taught by world-class experts. April 1–3, 2027 in Anaheim.
Every session is pitch-free and built around tactics you can use yourself, no big team required. Your All-Access ticket includes an extra day of workshops, full access to AI Business World, and recordings of everything.
GET MY ALL-ACCESS TICKET — SAVE $800#2: Compare Audience Size and Growth Rate
Once you add other company pages to your list, you can start tracking how your business’ audience size and growth rate compare. On desktop, the dashboard’s Follower Metrics panel automatically ranks pages by new followers so you can quickly identify which competitor is growing fastest and where your business fits into the mix.
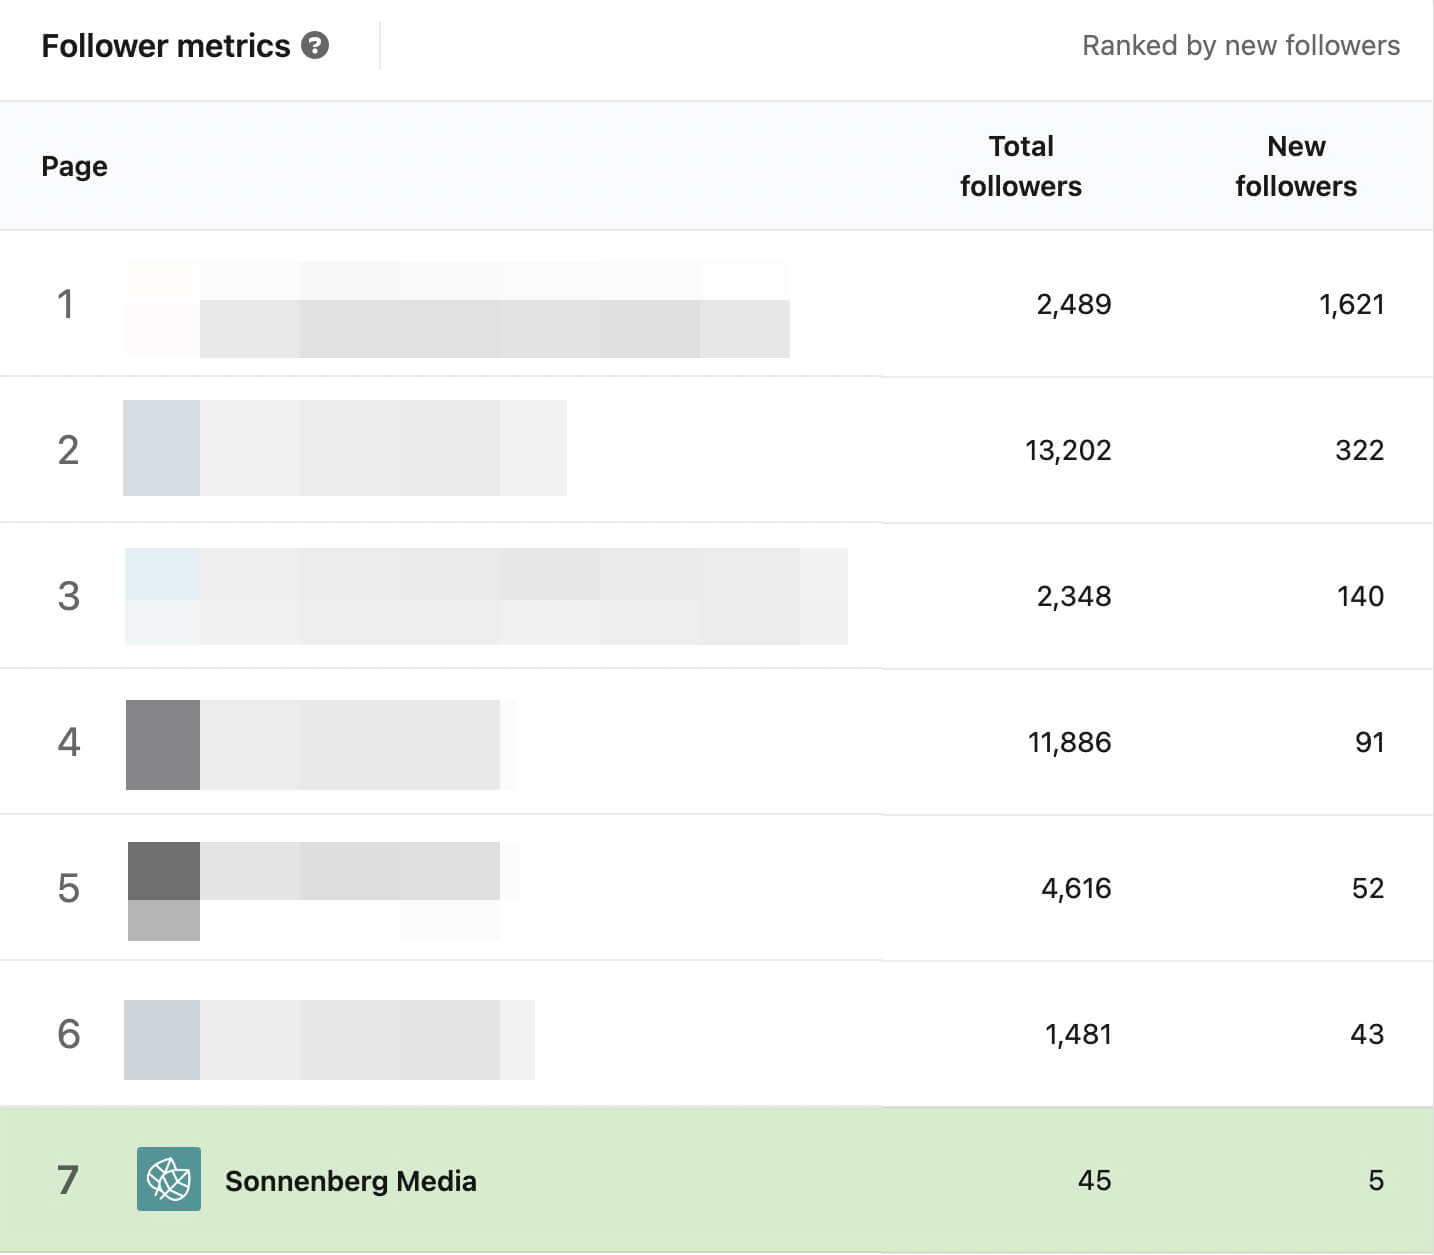
The Follower Metrics panel tallies new followers gained for each page so you can easily quantify growth. Here are a few questions that you can use to frame your analysis:
- Did one of your biggest competitors attract double or triple the number of followers your page accumulated?
- Is another business in your space far outperforming others in terms of audience growth?
- Where does your business fall on the chart over the past week, month, quarter, or year?
By default, the competitor analytics dashboard shows results for the previous 30 days. You can use the Time Range drop-down menu to choose one of the preset timeframes or select custom dates. To see how your company page has measured up during various timeframes, choose a few different ones and compare.
New follower metrics can tell you a lot about how well a business is marketing itself, including if it’s publishing valuable content. But like any metric, it’s more meaningful with added context.
The Follower Metrics panel also charts total followers so you can easily track growth rate over any preset or custom timeframe. After all, getting 100 new followers leads to much more significant growth for a small page than it does for a large page. Here are a few questions to consider as you review the data:
- Did a competitor grow at a significantly faster rate than other pages?
- Did a competitor grow substantially during a certain week or month?
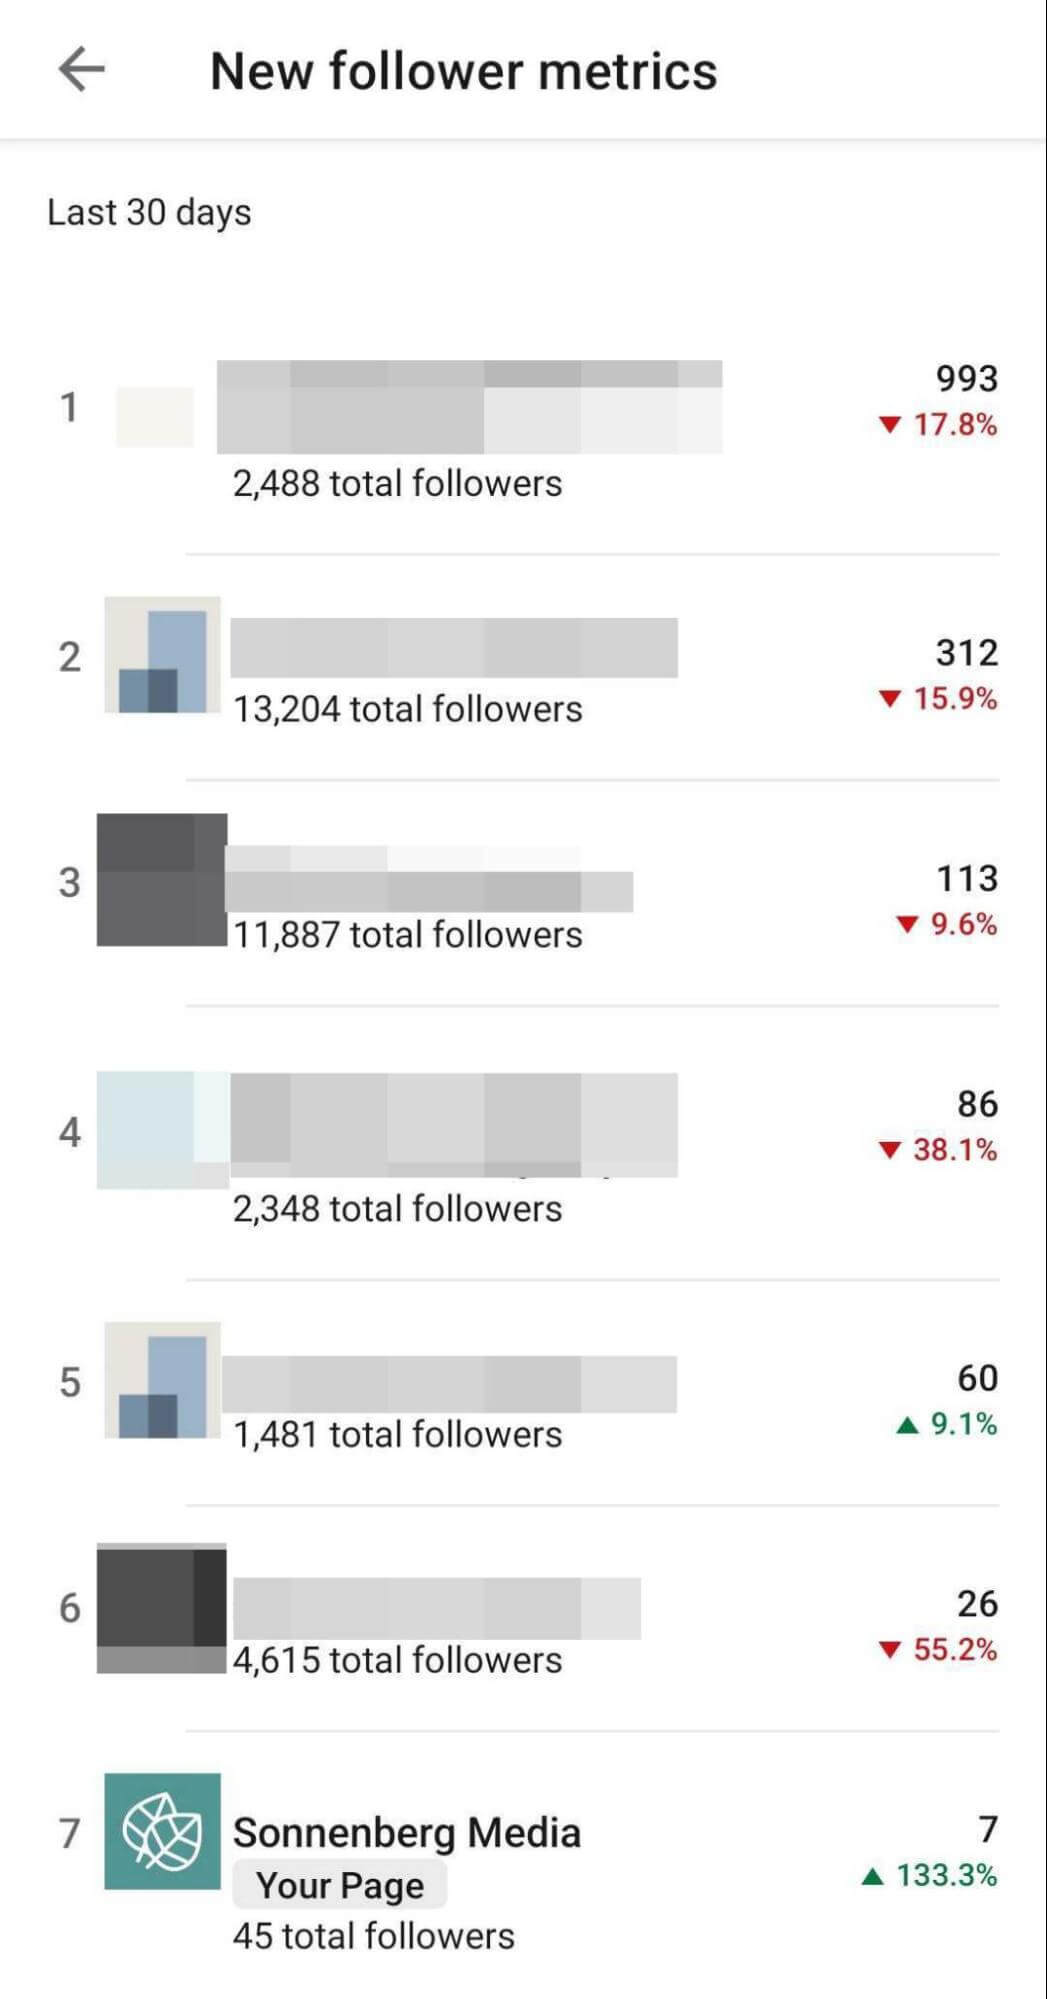
When you check competitor growth in the LinkedIn mobile app, you can see some helpful comparative metrics. On the New Follower Metrics panel, the app automatically compares new followers for the past 30 days to the previous period. This calculation helps gauge how quickly your page is growing and ensures it’s moving in the right direction.
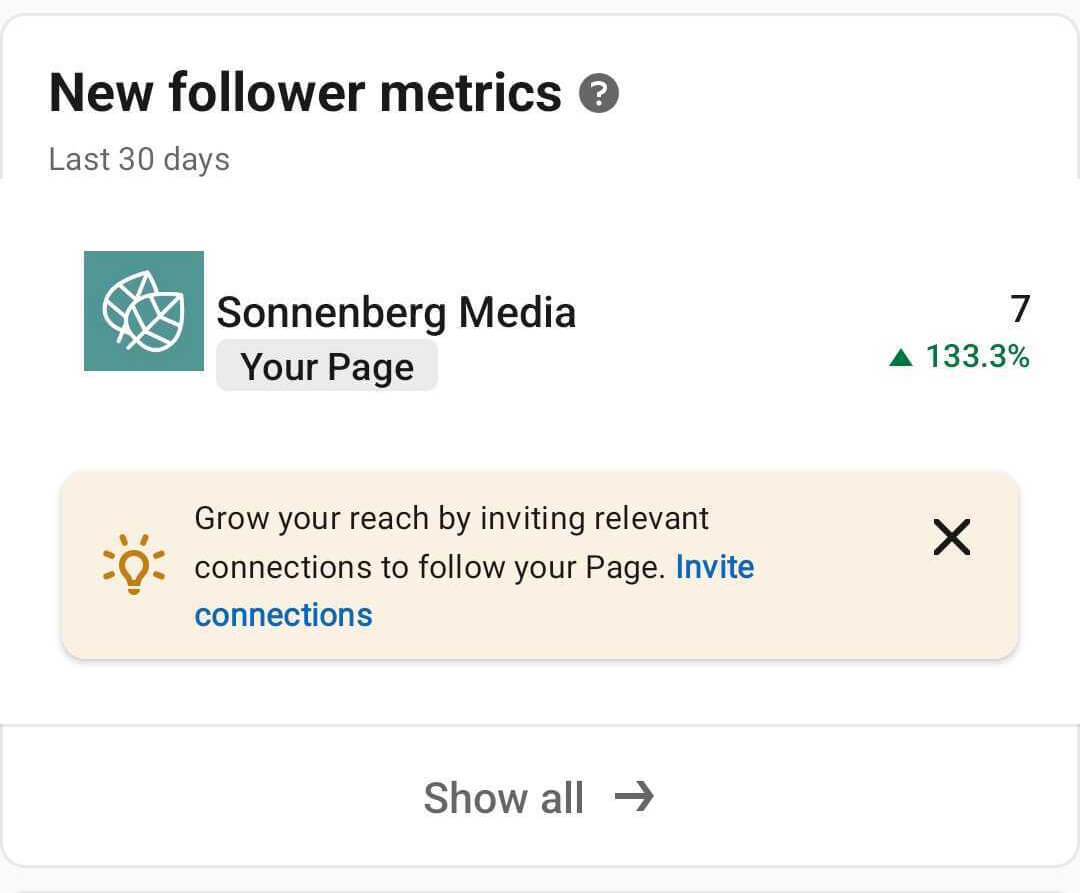
Tap Show All to see the full list including comparative metrics for each page. Some pages may have gained more followers than yours did in the past 30 days. But how does their growth look over time? Pay close attention to pages that have a high growth rate, as they may be actively running growth-minded campaigns.
#3: Reverse-Engineer Page Growth
In many cases, you can discover the driver behind a page’s growth by visiting the page itself. On a desktop device, select any high-growth company page from your list and navigate to its Posts tab. LinkedIn automatically sorts page content by performance so top content appears at the beginning of the list.
If the page has any top-ranked posts with significant engagement, there’s a good chance that they contributed to the page’s growth. Click to view or save the posts for further research, and read the comments to learn more about the context including what followers appreciate about the content and the page.
If the page doesn’t seem to have any top-ranked organic posts, tap the Ads tile to take a look at paid content. Unlike the organic content feeds, the paid content feed doesn’t display engagement so you can’t always tell which LinkedIn ads are outperforming others. But you can spy on your competitors’ ads and get a sense of what’s working for them.

Tired of Guessing Which AI Moves Matter?
New AI tools and strategies launch every week — and figuring out which ones matter takes hours you don't have.The AI Business Society filters the noise for you, with expert-led training you can put to work the same day — plus a community of marketers sharing what's actually working.
I'M READY FOR REAL AI RESULTS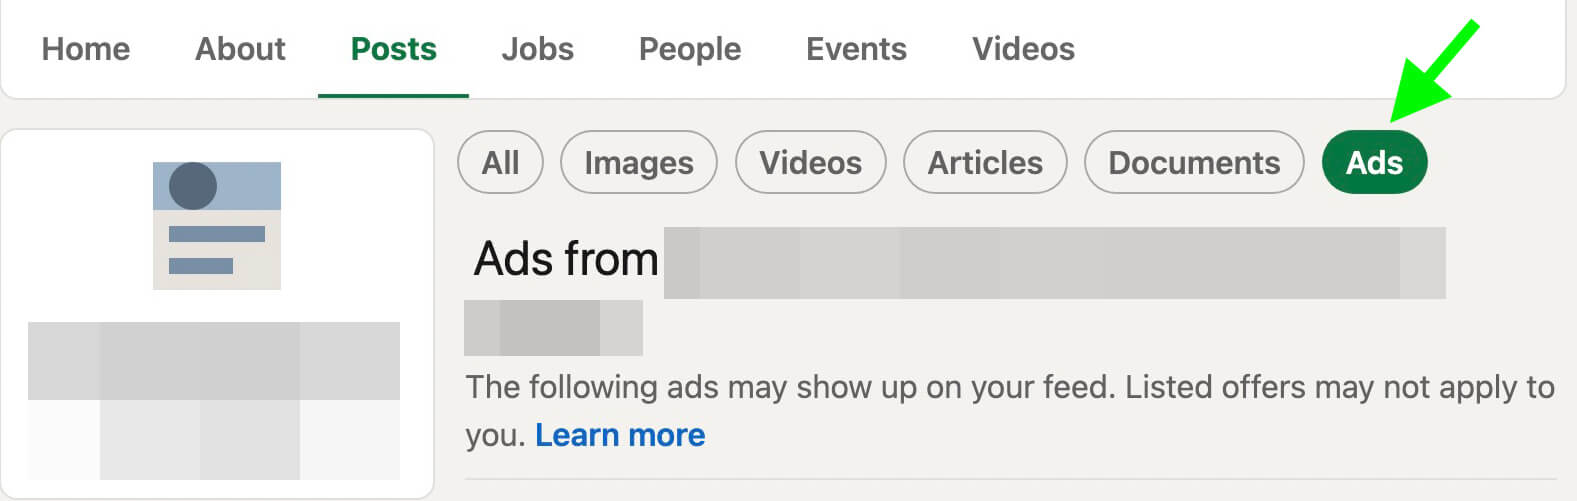
Company pages don’t always grow via their own organic content and ads alone. In some cases, they gain added visibility via high-profile employees such as founders and CEOs. To find these public figures, check the People tab on the company page.
Then scroll down to the People You May Know section. You’ll be able to see employees who are first-, second-, or third-degree connections to you. And if you use LinkedIn’s premium Sales Navigator platform, you’ll be able to identify decision-makers easily.
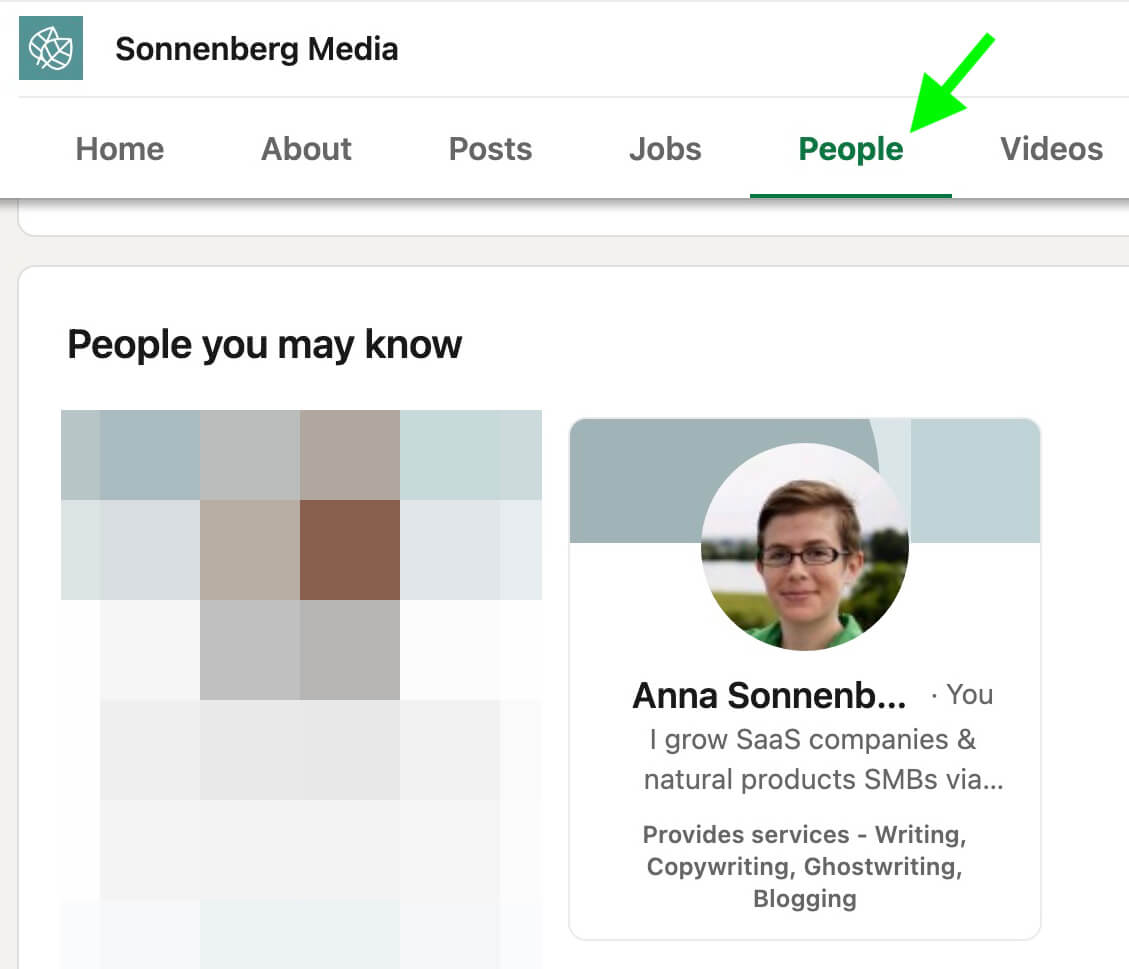
From here, you can take a closer look at employees’ profiles and see the kinds of content they post about their organizations. For example, they may share company page content or write their own unique takes. If you spot a great tactic for boosting visibility or growth, think about how you could reinterpret it and make it specific to your brand.
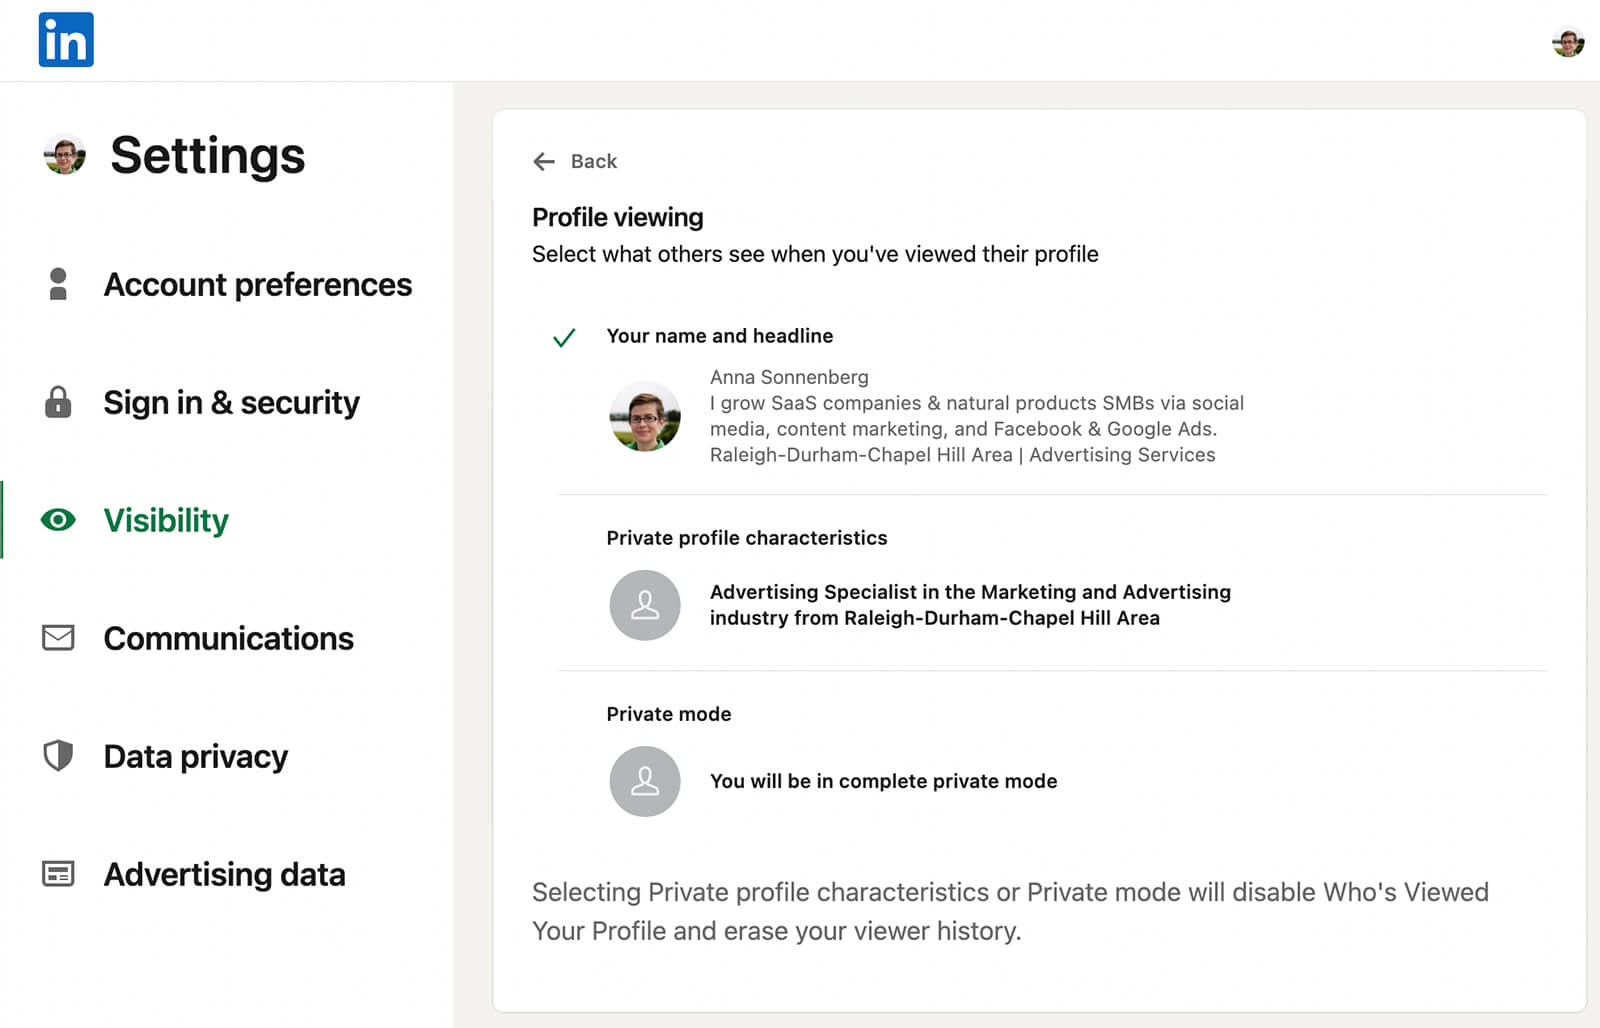
Don’t want the competition to know you’re checking out their profiles? Consider updating your profile’s privacy settings first. While it isn’t possible for company page admins to tell who visited, LinkedIn members can see some or all of the people who visited their profiles.
To make this change, open your profile settings and navigate to Visibility. From the menu, select Profile Viewing. Then turn on private mode so no one will be able to see that you viewed their profile. Note that this option also disables your ability to see who’s viewed your profile.
#4: Check Competitor Highlights for a Quick Content Comparison
Monitoring follower metrics is helpful for brands aiming to grow their audiences while keeping up with the competition. But audience size doesn’t always correlate with customer engagement or conversion rates.
When you want to know which brands are doing a great job of engaging followers and building customer relationships, check the content metrics on your competitor analytics dashboard. The LinkedIn mobile app has a handy Highlights panel that you can use to get a quick overview.
The Competitor Highlights panel shows two metrics: total posts and engagement rate. Are you publishing more or less than the competition? The total posts metric shows you the number of posts your page published over the past 30 days and calculates a percentage to show how much more or less your page posts compared to the competition.
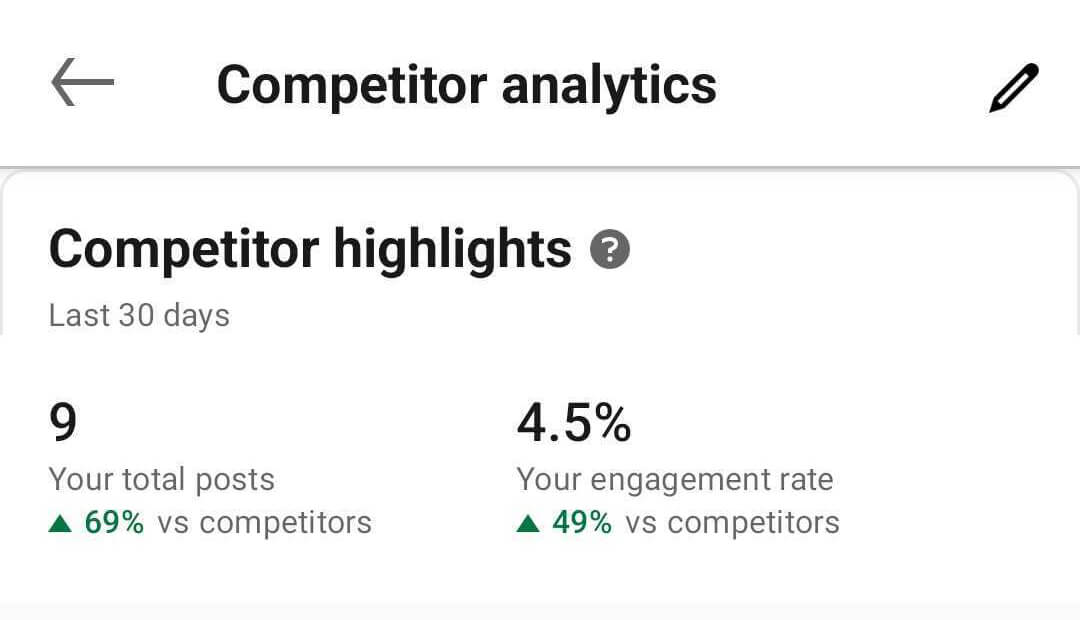
How does your engagement rate compare? The engagement rate metric calculates your reactions, comments, and shares per impression. Then it displays a percentage to compare your engagement rate to the competition so you can instantly see whether you’re creating content that’s more (green) or less (red) engaging than the competition.
#5: Compare Organic Content Metrics
To dig deeper into this company page comparison, check the Organic Content Metrics panel on a desktop device. The dashboard automatically sorts competitors by total engagements so you can see how your company page compares to others in terms of reactions, comments, and reposts.
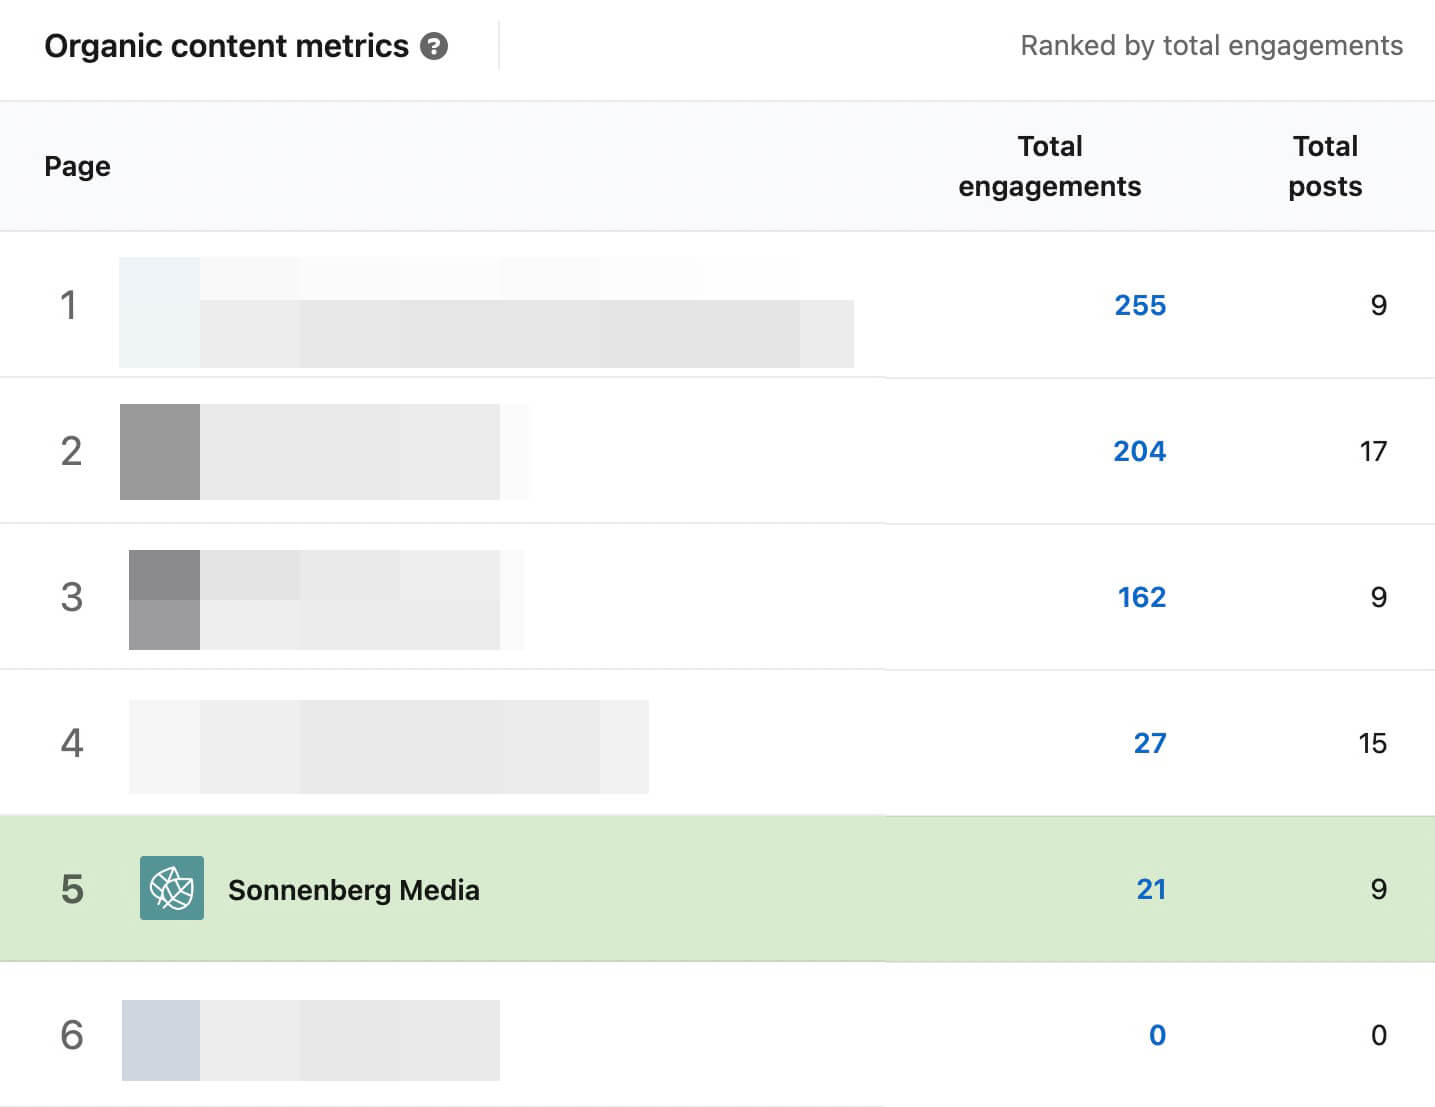
Once again, total numbers are helpful for gauging activity quickly. Yet so many other factors can affect engagement. For example, the total number of posts a company page published can significantly affect engagement. Since the Organic Content Metrics panel also lists the total number of posts during the selected time period, this metric can put the engagement in context.
Neither the desktop version nor the mobile app displays engagement rates for competitors. But you can do a couple of manual calculations to add more nuance to these metrics. Here are some ideas to try.
- Divide the total engagements by the total posts to calculate engagement per post for each competitor. Do any of your competitors tend to generate significantly more engagement for an average post?
- Divide the total engagements by the total followers to calculate engagement per follower for each competitor. Do any of your competitors get unusually high engagement given their audience size?
Use the timeframe selector to compare organic content metrics across different time periods. For example, you might compare the past week, month, and quarter to look for patterns. Do some of your competitors appear to be increasing their engagement rates over time? You may want to watch these competitors more closely.
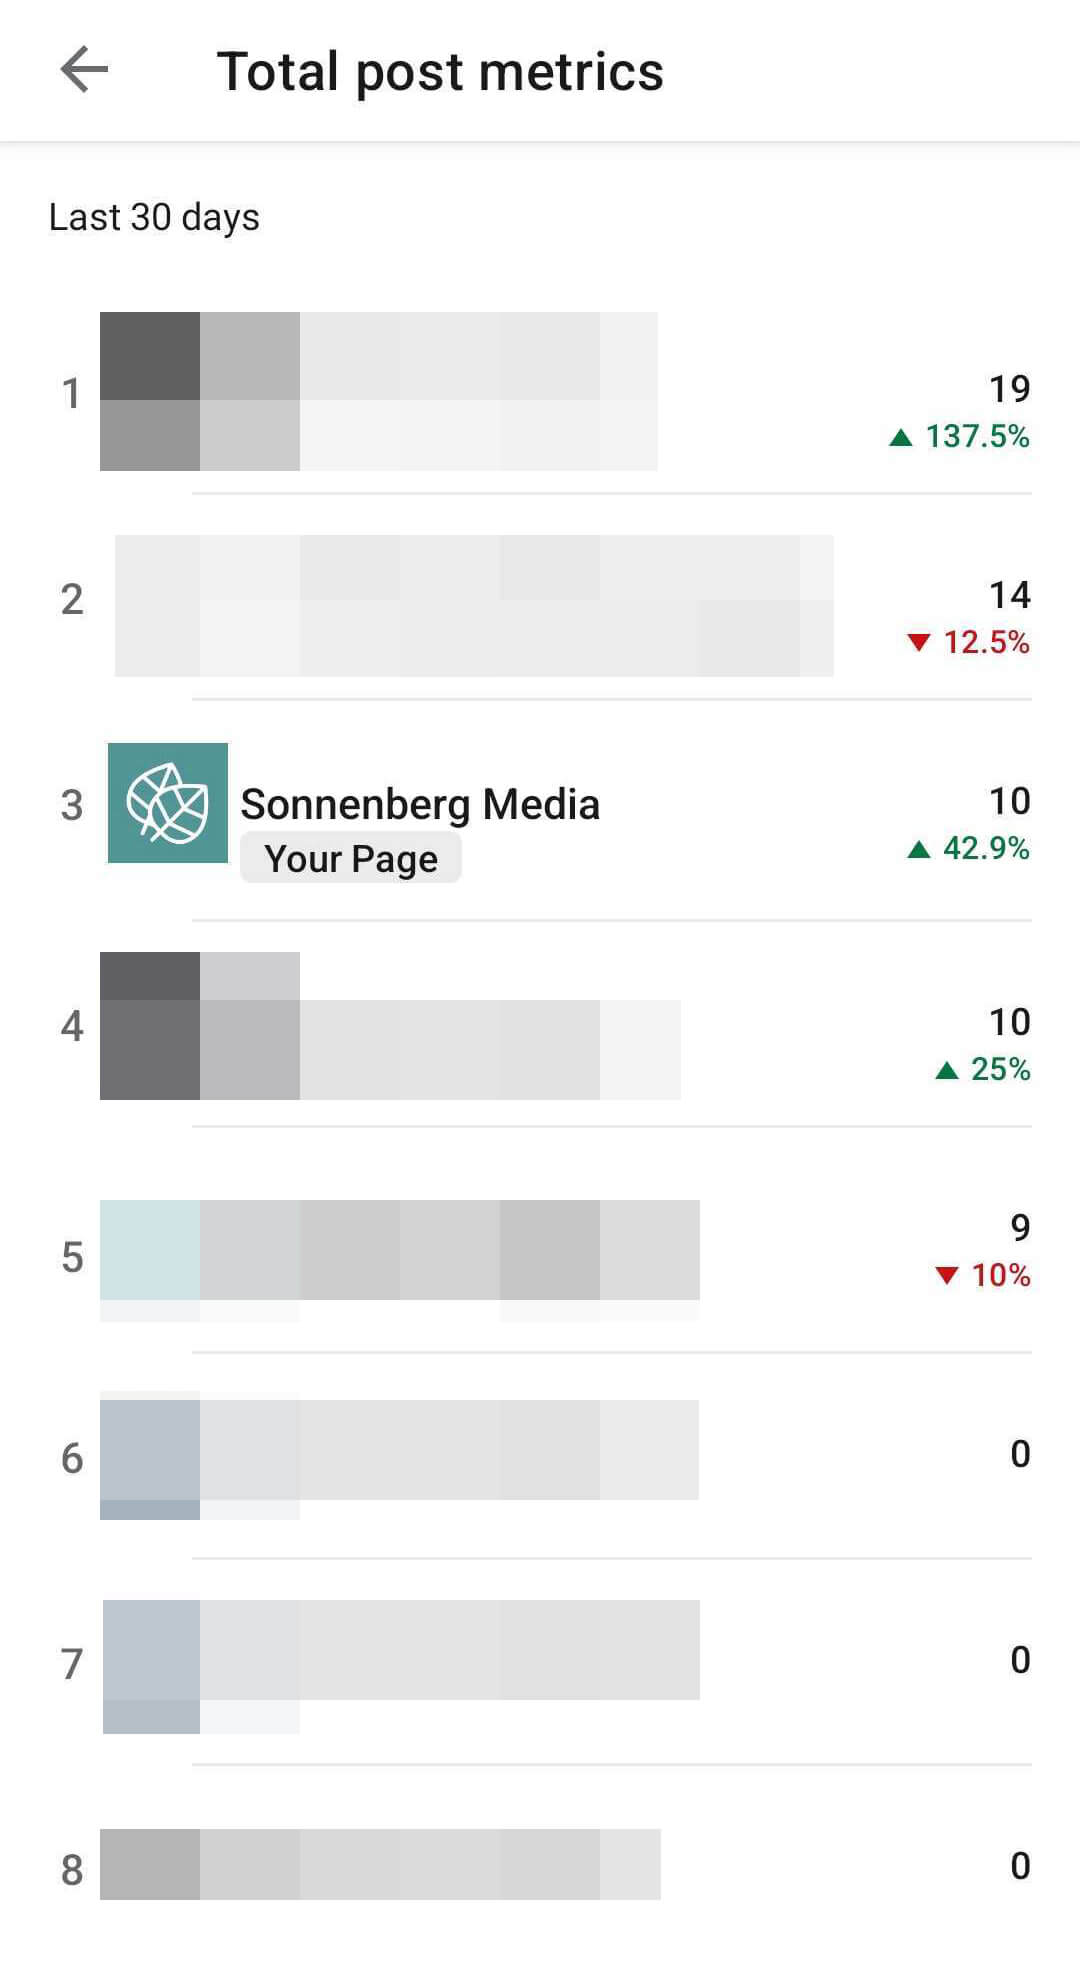
Using the mobile dashboard, you can see how your page’s publishing frequency compares to the competition. How many posts did you publish in the last 30 days, and how does that compare to the prior period? Go to the Total Post Metrics panel.
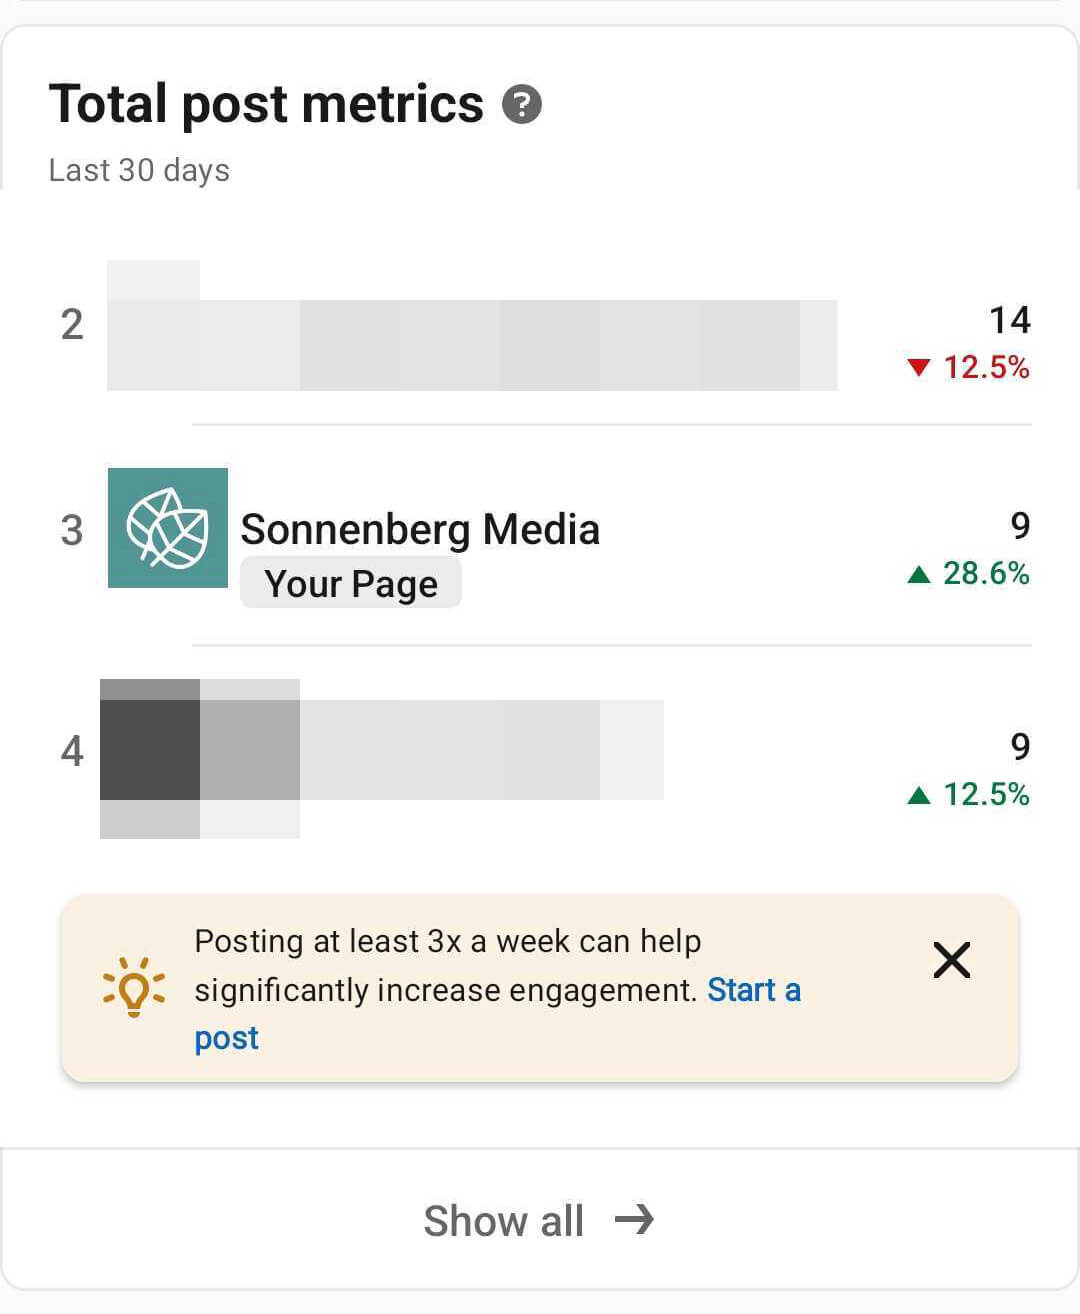
Tap Show All to see the full list and look for competitors who are publishing much more than normal.
#6: Review Competitor Content
LinkedIn’s competitor analytics dashboard doesn’t include links to posts or other content. But from the desktop version of the competitor analytics dashboard, you can click any business name to take a closer look at the company page’s organic content.
On any company page, select the Posts tab to review the organization’s organic content. By default, company page post feeds display all organic content. You can opt to browse images, videos, articles, or documents only or you can stay on the All tab to get a better overview of the company’s organic content.
Then review your competitors’ top-performing posts including their engagement. It’s helpful to note the content type, post format, and call to action for competitors’ top posts. To get a better sense of followers’ responses to your competitors’ content, read the comments. Note customer sentiment and company responses.
Then incorporate your competitor analysis into your organization’s content plan. Copying content won’t win your company page any originality points but exploring new tactics or positioning may improve your content, attract new followers, and streamline your funnel.
#7: Chart Competitor Analytics Over Time
Although the competitor analytics dashboard lets you set specific timeframes with a desktop device, it doesn’t let you visualize changes over time. To chart competitor analytics over time, export the data from the dashboard.
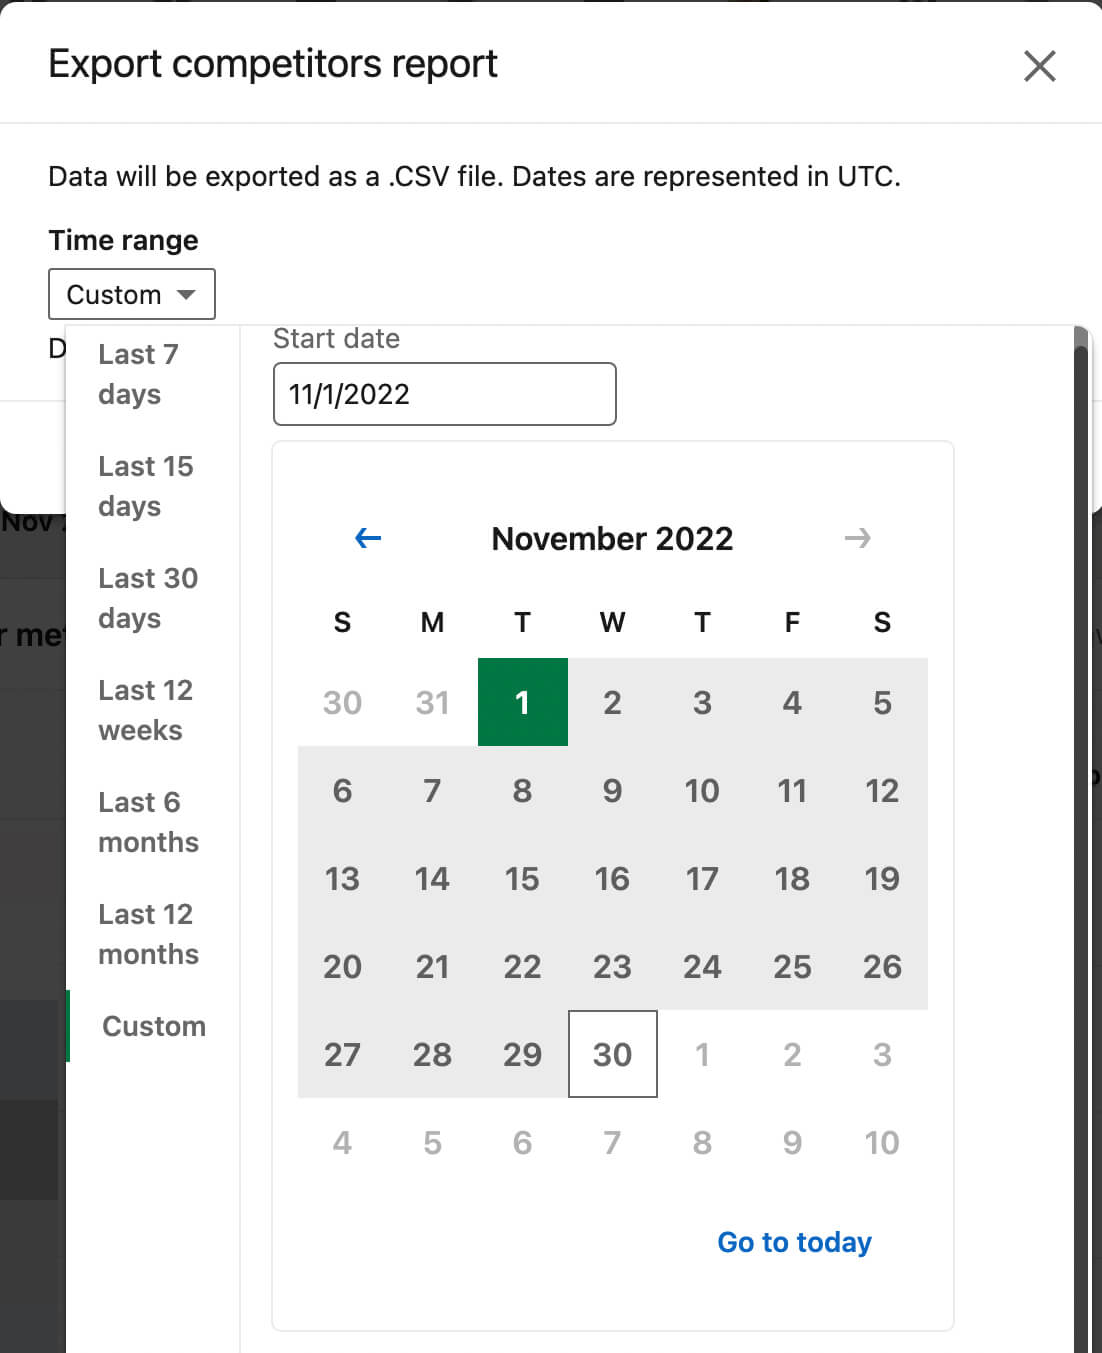
Then use the data to create your own charts and graphs or upload it to a third-party reporting tool that can visualize the information for you. Make a point to export this data each month as part of your standard reporting workflow so you can use the data in the way that works best for your team.
Conclusion
The LinkedIn competitor analytics dashboard is a welcome addition to the platform’s company page tools. With its benchmarking capabilities and comparative analytics tools, this dashboard can help marketers improve their approach to LinkedIn marketing while keeping an eye on the competition.
Stay Up-to-Date: Get New Marketing Articles Delivered to You!
Don't miss out on upcoming social media marketing insights and strategies! Sign up to receive notifications when we publish new articles on Social Media Examiner. Our expertly crafted content will help you stay ahead of the curve and drive results for your business. Click the link below to sign up now and receive our annual report!

Where Do You Actually Stand With AI?
Most marketers use AI, but they don't know what's holding them back from real results.
Our 3-minute quiz pinpoints the one gap keeping you stuck — and gives you the exact next step to fix it.
GET MY RESULTS