Need to quickly gain insights from your marketing efforts? Wondering how to use Google Data Studio to easily create visual dashboards?
In this article, you'll learn how to create and customize a Google Data Studio dashboard that delivers clear answers you need to improve your marketing. You'll also discover how to quickly create an entire Google Analytics dashboard in a single click.
To learn how to build reports in Google Data Studio, read the article below for an easy-to-follow walkthrough or watch this video:
Why Use Google Data Studio?
Do you ever feel like you're drowning in metrics and reports? With a tool like Google Data Studio, you can take reports filled with too much data and simplify them to get to the information that matters to your business.
Think about how your car dashboard works. When you look at your speedometer, you instantly know whether to hit the gas or pump the brake. You don't have to analyze it, think about it, or review it with a committee to figure out what your next step is. You just know.
Your marketing dashboards can be that simple to use when you have a platform that allows you to build them that way. Fortunately, that's what Google Data Studio does.
#1: Explore Google Data Studio Template Dashboards
To get started with Google Data Studio, go to datastudio.google.com. Make sure you sign in with the same Google account you use for Google Analytics.
Let's start by looking at some templates so you can see what's possible with Google Data Studio.
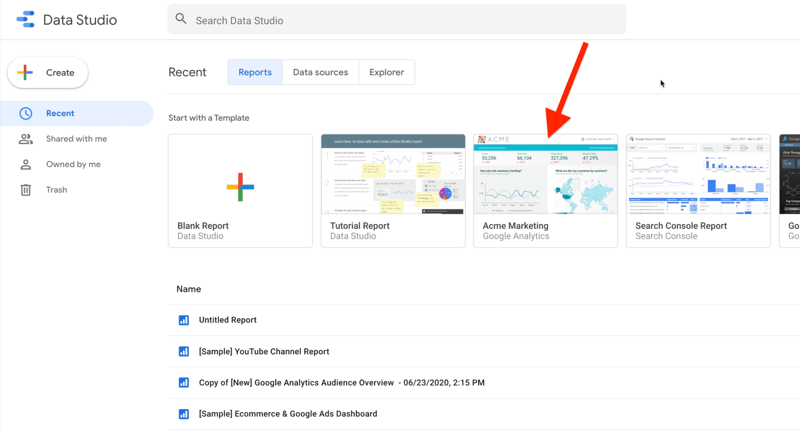
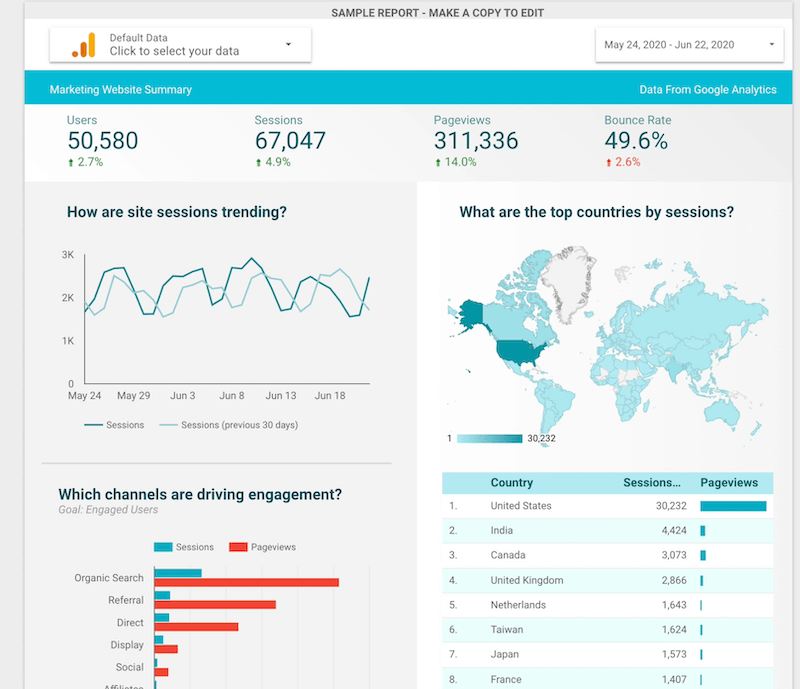
Here's an example of an existing Google Analytics report you might use. You could make a copy of this and connect it to your own analytics.
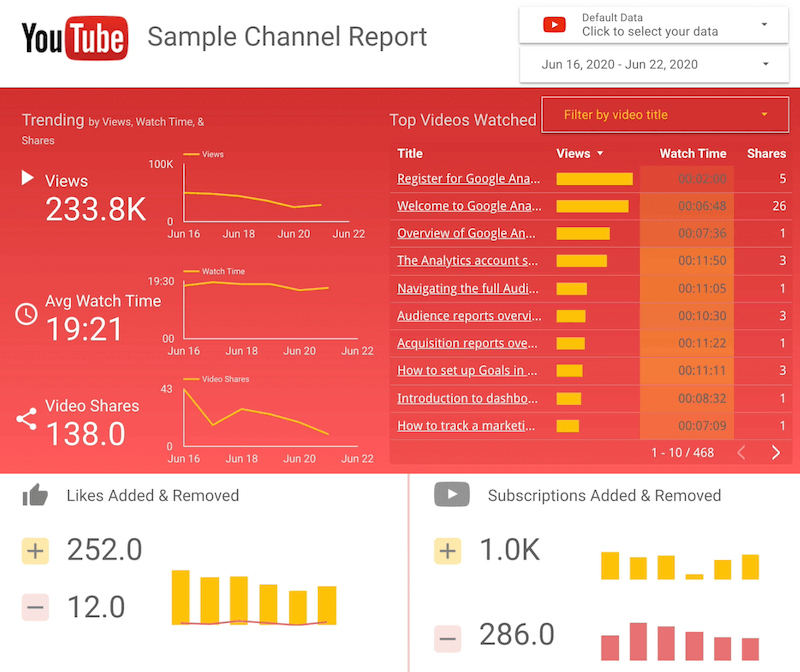
You could do the same thing with this YouTube dashboard. Just connect it to your YouTube account and get your own customized YouTube dashboard.
3 Days of World-Class Training—Zero Travel!

Couldn't make it to Social Media Marketing World and AI Business World this year? Get all of the great content at a fraction of the price with a Virtual ticket.
That’s full access to recordings of every keynote, workshop, and session—the ones people travel thousands of miles to see. Don't wait. Get your Virtual ticket and enjoy actionable content that you can watch anytime, anywhere.
I like Google Data Studio templates but I use them for inspiration only. Templates were created to answer somebody else's business questions, not necessarily yours. Creating your own dashboards from scratch allows you to answer the questions that matter to your business.
#2: Explore Custom Google Data Studio Dashboards
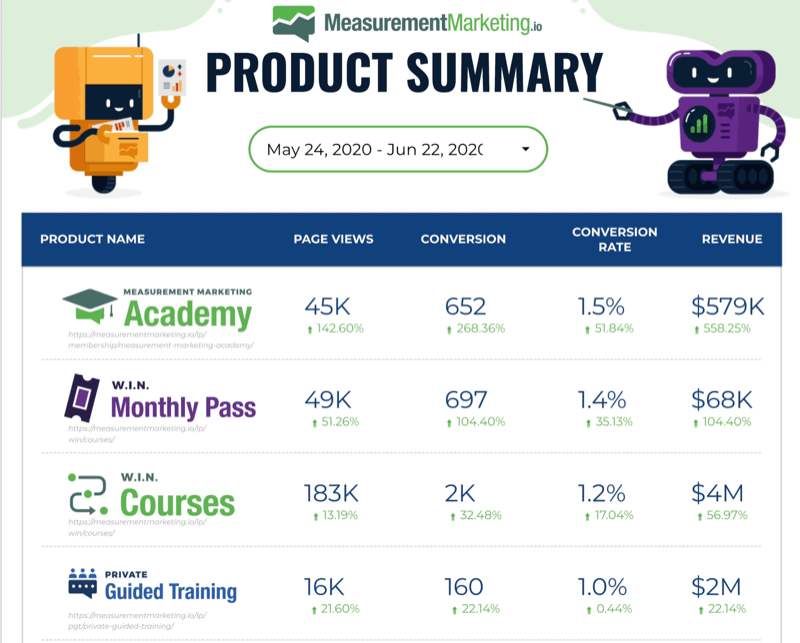
Now let's look at what you can do with custom dashboards. The one below is a product summary. As a business owner, I need to be able to quickly determine which products are selling and which aren't. That's all I care about. I don't need to see a million different details; I just want to see the relevant data so I know whether to pump the brake or hit the gas.
In this report, you can see key data for a variety of products including page views for those products, conversion rates, and revenue generated. All of these details are in one easy-to-read report.
Now suppose that the monthly pass program isn't performing as expected so you want to know more details about that. In this case, you could use the report below, which offers a deeper dive into the data. It's important to know not only what your results are, but also almost as importantly, how you got there.
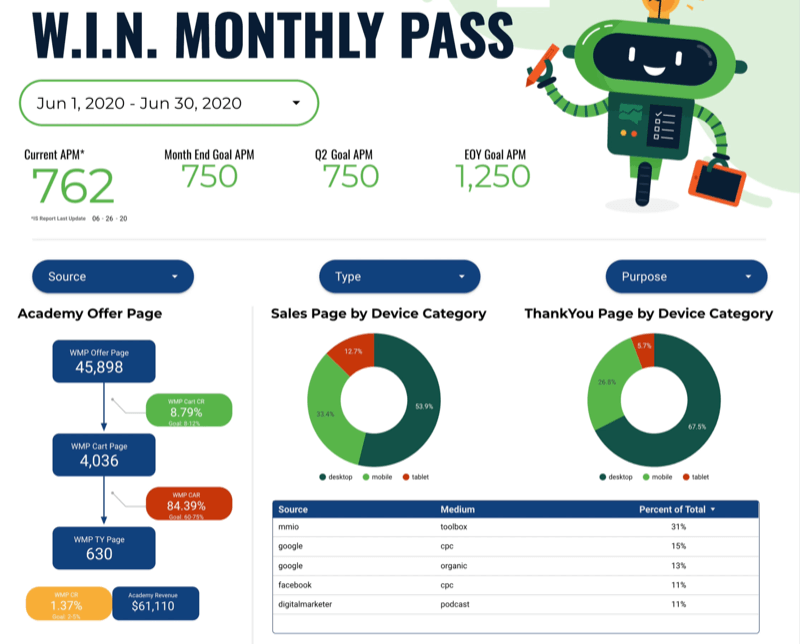
The little customer journey template on the left side of this report reveals how many people are seeing the offer page and how many are going to the next step, which in this case is the cart page. From there, how many convert to an actual purchase?
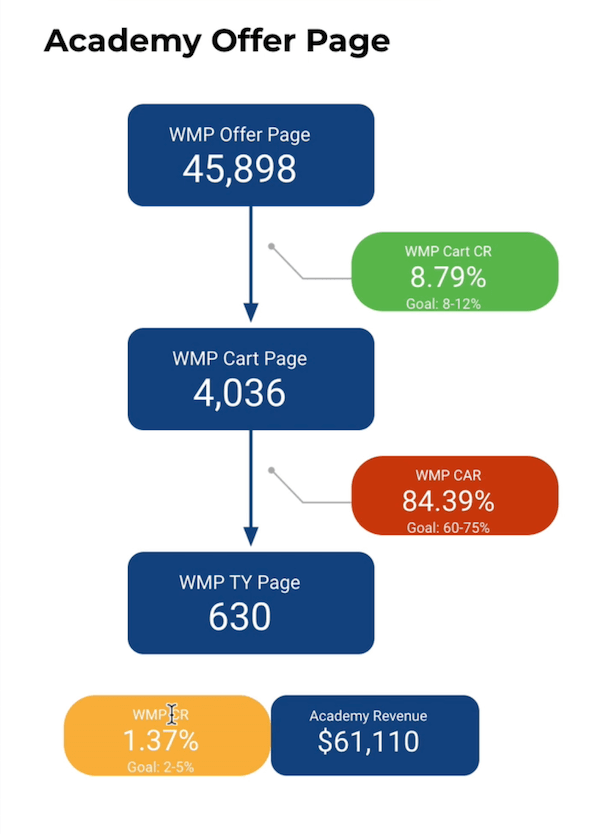
What's nice about this report is it's designed to give you conversion rates so you can quickly see if each step is converting at the rate you expect.
Notice there's a goal for each step. You have a forecast of how you believe this should be working, and can measure against that forecast to determine if this particular customer journey is working as intended.
Obviously, the numbers tell you this information, but the color-coding—called conditional formatting in Google Data Studio—makes it easy to digest at a glance. In this case, yellow tells you it's kind of in range but not perfect. Red indicates it's way too high. And green signifies it's just right.
So how do you know where to focus your efforts? If you look at the data in this dashboard, you can see there's an issue with cart abandonment so you'd want to figure out why that might be happening. You could take the conversation to your marketing team to improve that step.
A dashboard like this tells you whether you're actually getting it right. You don't have to spend hours trying to figure out what the data means. You instantly know what it means because of how this report was designed in Google Data Studio.
Pro Tip: Another place to find incredible ideas for inspiration is the Data Studio gallery. You'll find more featured dashboards, as well as dashboards from the community. Take a peek at what other people are measuring and how they're measuring it.
#3: Create a Custom Dashboard in Google Data Studio
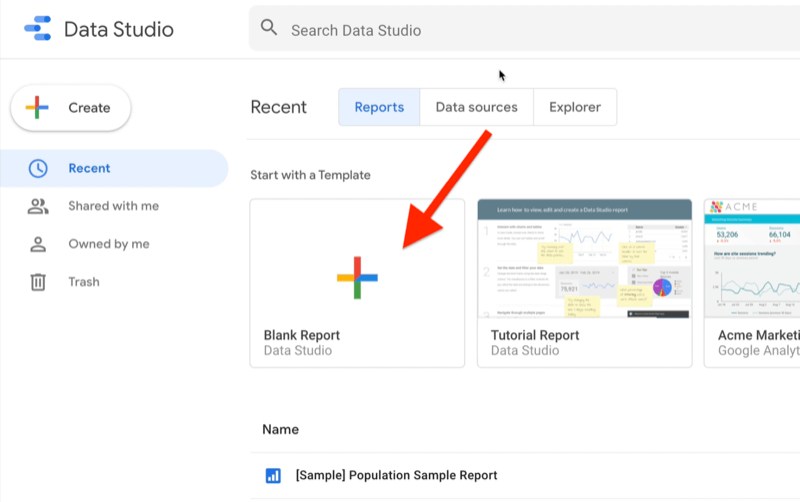
If you want to create a custom dashboard in Google Data Studio, click where it says Blank Report.
Want to Unlock AI Marketing Breakthroughs?
If you’re like most of us, you are trying to figure out how to use AI in your marketing. Here's the solution: The AI Business Society—from your friends at Social Media Examiner.The AI Business Society is the place to discover how to apply AI in your work. When you join, you'll boost your productivity, unlock your creativity, and make connections with other marketers on a similar journey.
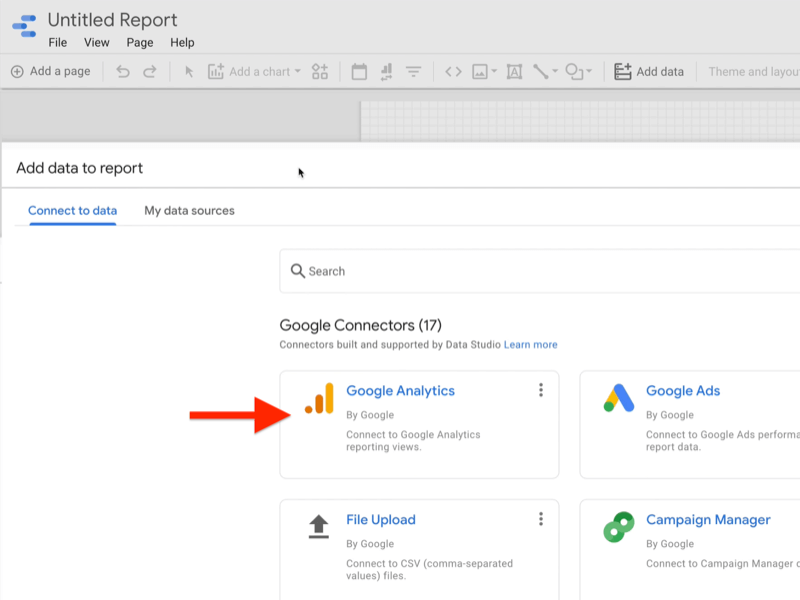
I'M READY TO BECOME AN AI-POWERED MARKETERYou're then prompted to tell Data Studio where to get your data. While this tool offers handy dashboards and reports you can use, it doesn't actually store any data. It has to get that data from someplace else.
In this case, let's say your data will come from Google Analytics so click where it says Google Analytics.
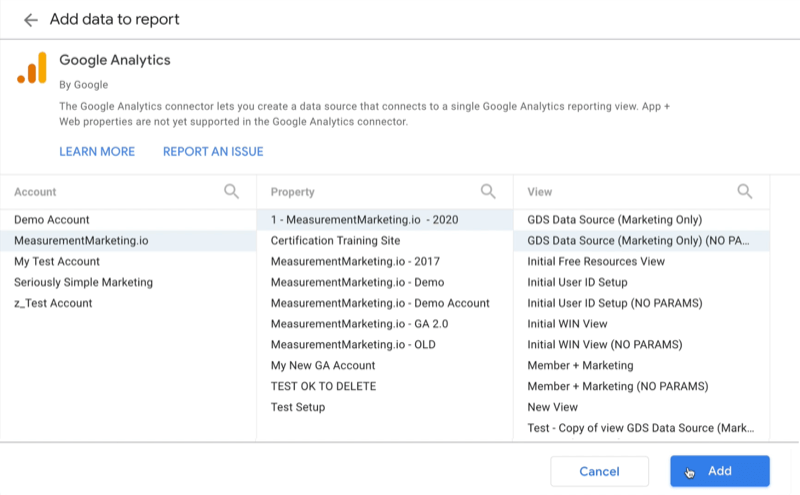
On the next page, choose which Google Analytics account you want the information from and then click Add.
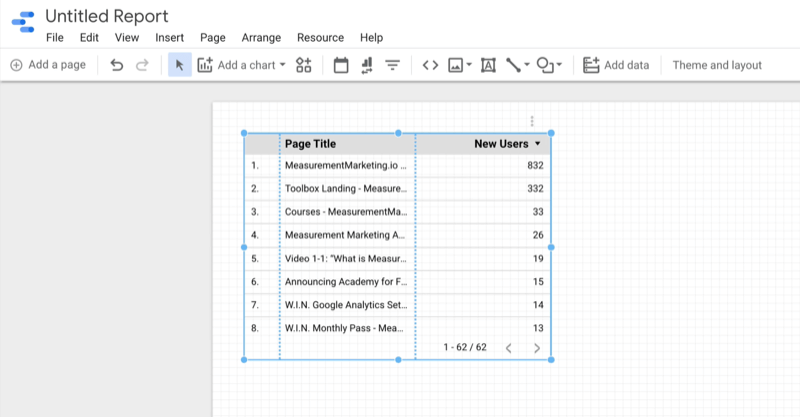
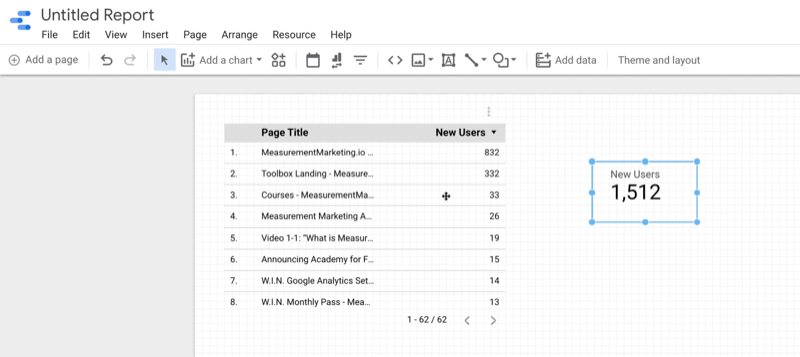
Once your data starts flowing into Google Data Studio, you'll see a little table in your report that lets you know it's working. From here, you can start adding charts and take advantage of Data Studio's features to customize your report.
Click Add a Chart on the toolbar to see various chart elements you can choose from.
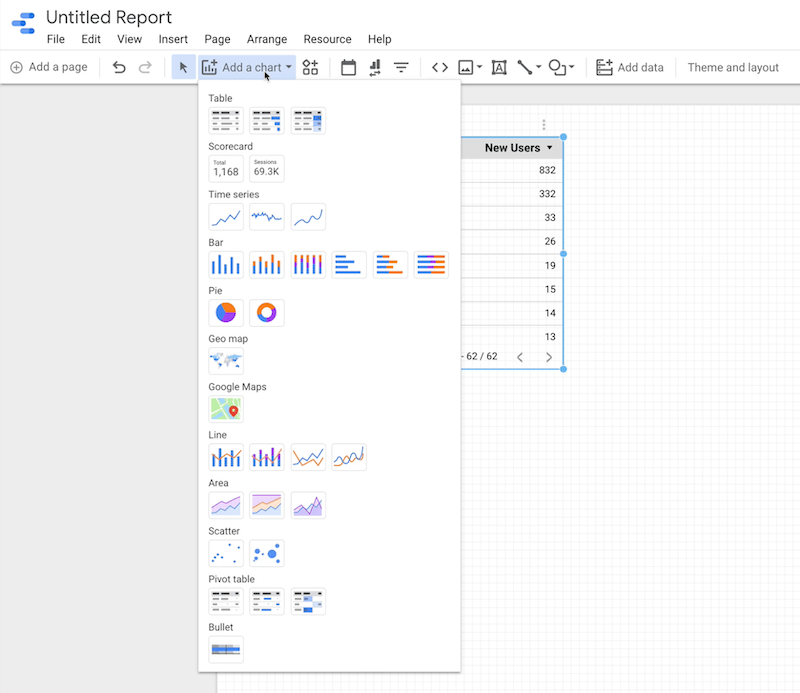
If you want to see data like user counts or numbers, click one of the Scorecard options from the Add a Chart drop-down menu.
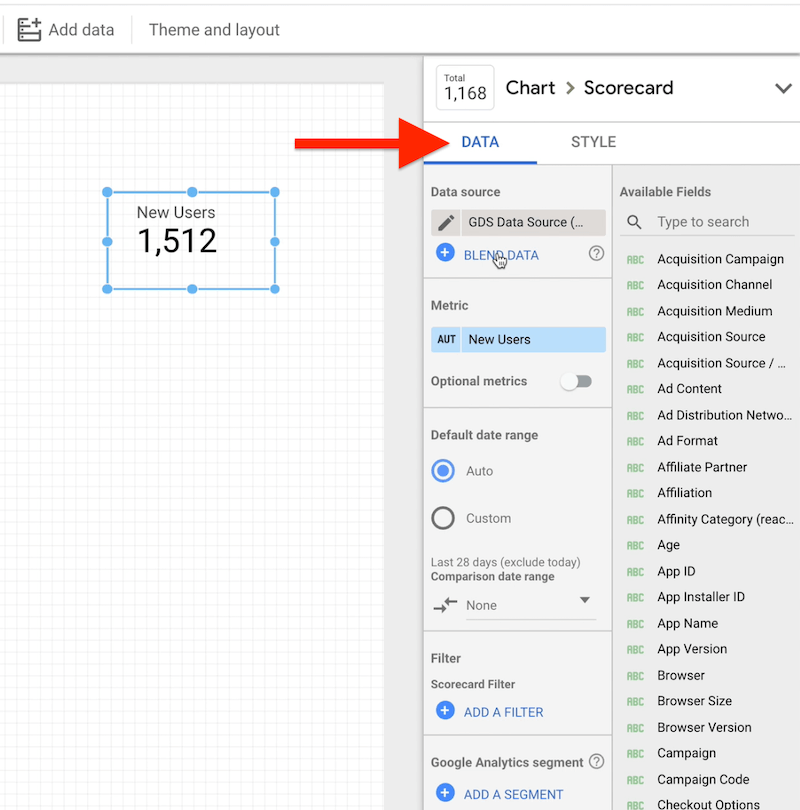
On the right side of the screen, you'll then see two tabs—Data and Style.
The Data tab tells you where this element is getting its data.
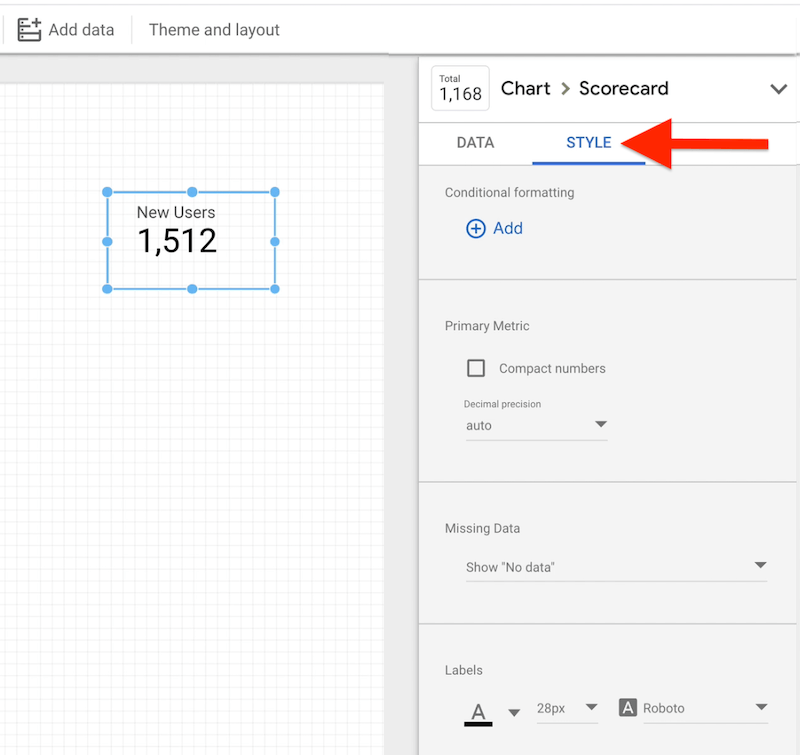
If you click the Style tab, you'll see options for formatting your report. This is where you can change the colors with conditional formatting. You can also edit the fonts and background colors to give it a custom look.
Setting up a properly functioning dashboard in Google Data Studio does take some work. But the more effort you put into planning your dashboard—identifying the questions you're trying to answer and what actions you'll take based on those answers—the better your dashboards will be. Make sure you're always trying to tie data to action.
#4: Create a One-Click Google Data Studio Dashboard via Google Analytics Reports
Now I want to show you the fastest way to create a fully functional Google Data Studio dashboard report based on your own Google Analytics. You can do it with a single click of the mouse.
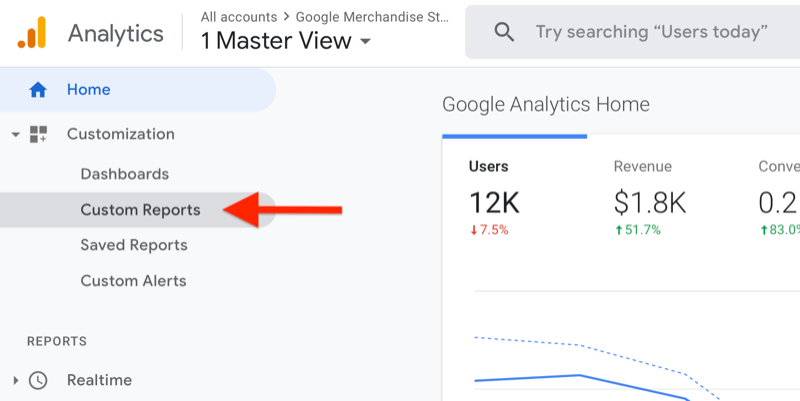
To create this report, go into Google Analytics and navigate to Customization > Custom Reports.
At the top of the custom reports section, look for a message similar to this one offering the option to learn more about Google Data Studio paired with Google Analytics and offering a few popular dashboard templates:
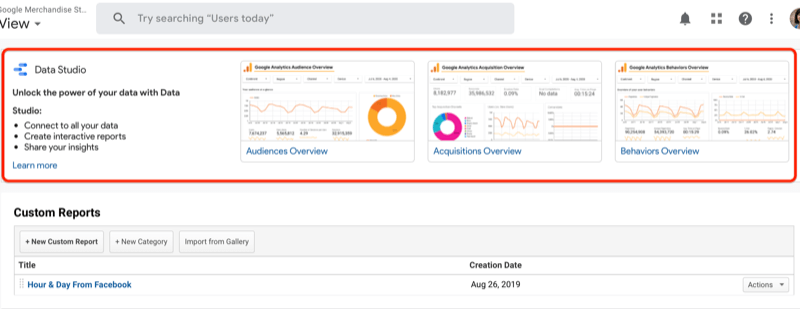
If you don't see this exact message in this exact spot, take a few seconds to look around. You'll probably find something similar to it.
You have three options to choose from: Audiences Overview, Acquisitions Overview, and Behaviors Overview. Select the option that aligns with what you want to learn more about: your audiences, acquisitions (where the traffic is coming from), or behaviors (the actions your audience is taking).
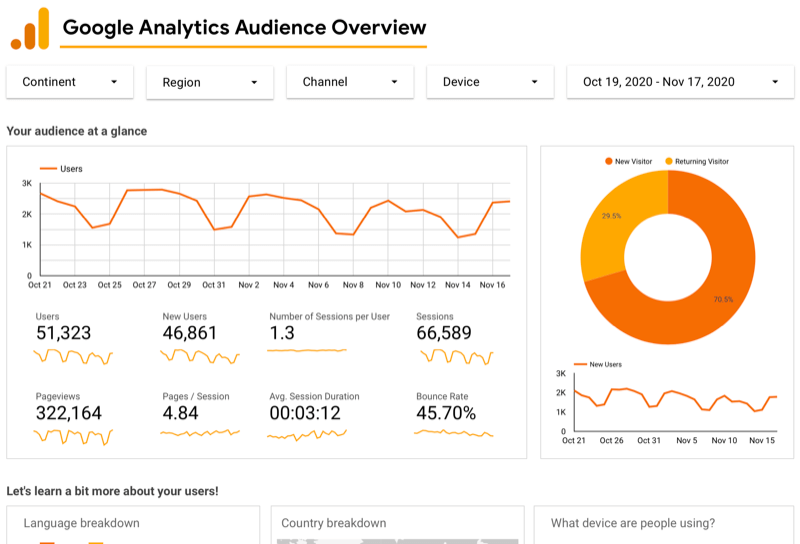
Suppose you want to learn more about your audiences. After you click that option, Google Data Studio will automatically open and connect the dots to your Google Analytics; you don't have to define a data source. Data Studio automatically creates all of these charts and fills them with the data from your Google Analytics account.
So how do you actually use this report? I recommend that you customize it for your business needs by clicking Edit and Share in the top-right corner. If you don't care about new visitors or returning visitors, for instance, just delete that chart. And if something is missing from the report, you can add a new chart for it.
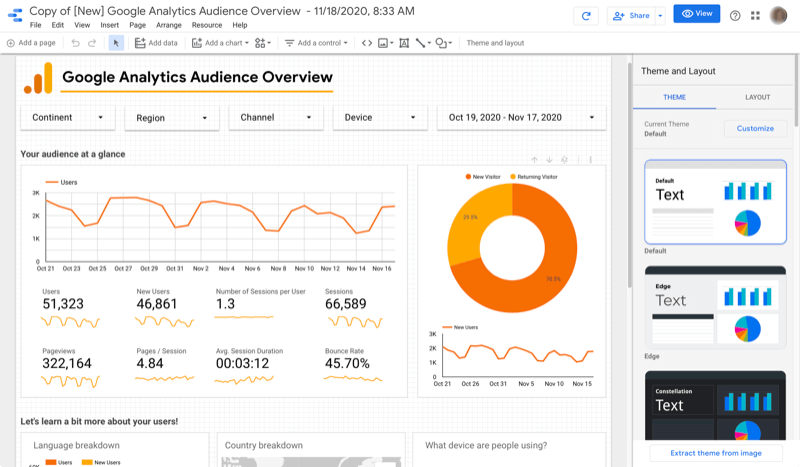
This report is a great way to save a lot of steps but you'll want to customize it to your liking so you can get answers to the questions you're asking.
Conclusion
You probably have a lot of reports but are those reports leading to action? Maybe you've got dashboards, but in reality, those dashboards are just prettier-looking reports. There's no story there. That's where Google Data Studio comes in. Data Studio allows you to set up custom reports to get the exact answers you need so you won't get confused and distracted by the data you don't care about.
What do you think? How might you use Google Data Studio to report on your own marketing? Share your thoughts in the comments below.
More articles on social media analytics:
- Learn how to build and save valuable Google Analytics custom reports.
- Discover a five-step framework for marketing analysis.
- Explore five Facebook Analytics reports to help you make data-backed business decisions.

Curious About How to Use AI?
Our newest show, AI Explored, might be just what you're looking for. It's for marketers, creators, and entrepreneurs who want to understand how to use AI in their business.
It's hosted by Michael Stelzner and explores this exciting new frontier in easy-to-understand terms.
Pull up your favorite podcast app and search for AI Explored. Or click the button below for more information.
