Want to improve your YouTube Shorts content? Wondering which shorts get the best audience retention?
In this article, you’ll discover how to use the latest YouTube analytics to analyze the performance of your Shorts videos.

Why YouTube’s New Shorts Analytics Matter for Marketers
Since YouTube launched Shorts in September 2020, this short-form video format has experienced explosive growth. As of June 2022, Shorts generates 30 billion views every single day.
Because shorts have so much potential for getting views, attracting subscribers, and driving conversions, it’s become crucial for brands to prioritize this short-form format. Yet it hasn’t always been easy for marketers to analyze shorts’ performance.
Earlier versions of YouTube analytics included metrics like video views, thumbnail impressions, and audience demographics. However, these metrics only told part of the story, especially for Shorts. For example, they didn’t provide audience demographics specifically for Shorts or offer data on performance in the Shorts feed.
These omissions were unfortunate because YouTube shorts’ performance largely depends on whether viewers choose to watch the shorts they see in their feed. In theory, shorts with a higher rate of views versus swipes are likely to perform better. Yet options for measuring this metric weren’t readily available.
As of March 2023, however, marketers can access YouTube Shorts analytics for feed impressions, views versus swipes, and audience demographics. Since these metrics are available for both the channel and individual shorts, they can inform content-level analysis and provide big-picture insights.
These updated in depth analytics for Shorts are available in YouTube Studio on desktop and in the mobile app. However, the depth of the data you can access in the mobile YouTube app is limited. I recommend using the desktop version of YouTube Studio to get full access to advanced analytics and comparative metrics.
#1: How to Analyze YouTube Shorts Feed Impressions
To analyze your channel’s impressions in the Shorts feed, open YouTube Studio and select the Analytics dashboard. Navigate to the Content tab and select the Shown in Feed chart. Then choose the timeframe you want to analyze.
On this graph, YouTube Studio displays the number of times your shorts were shown in the Shorts feed. To see daily breakdowns, hover over any point on the graph. In the example below, the channel saw a significant spike immediately after a Shorts upload.
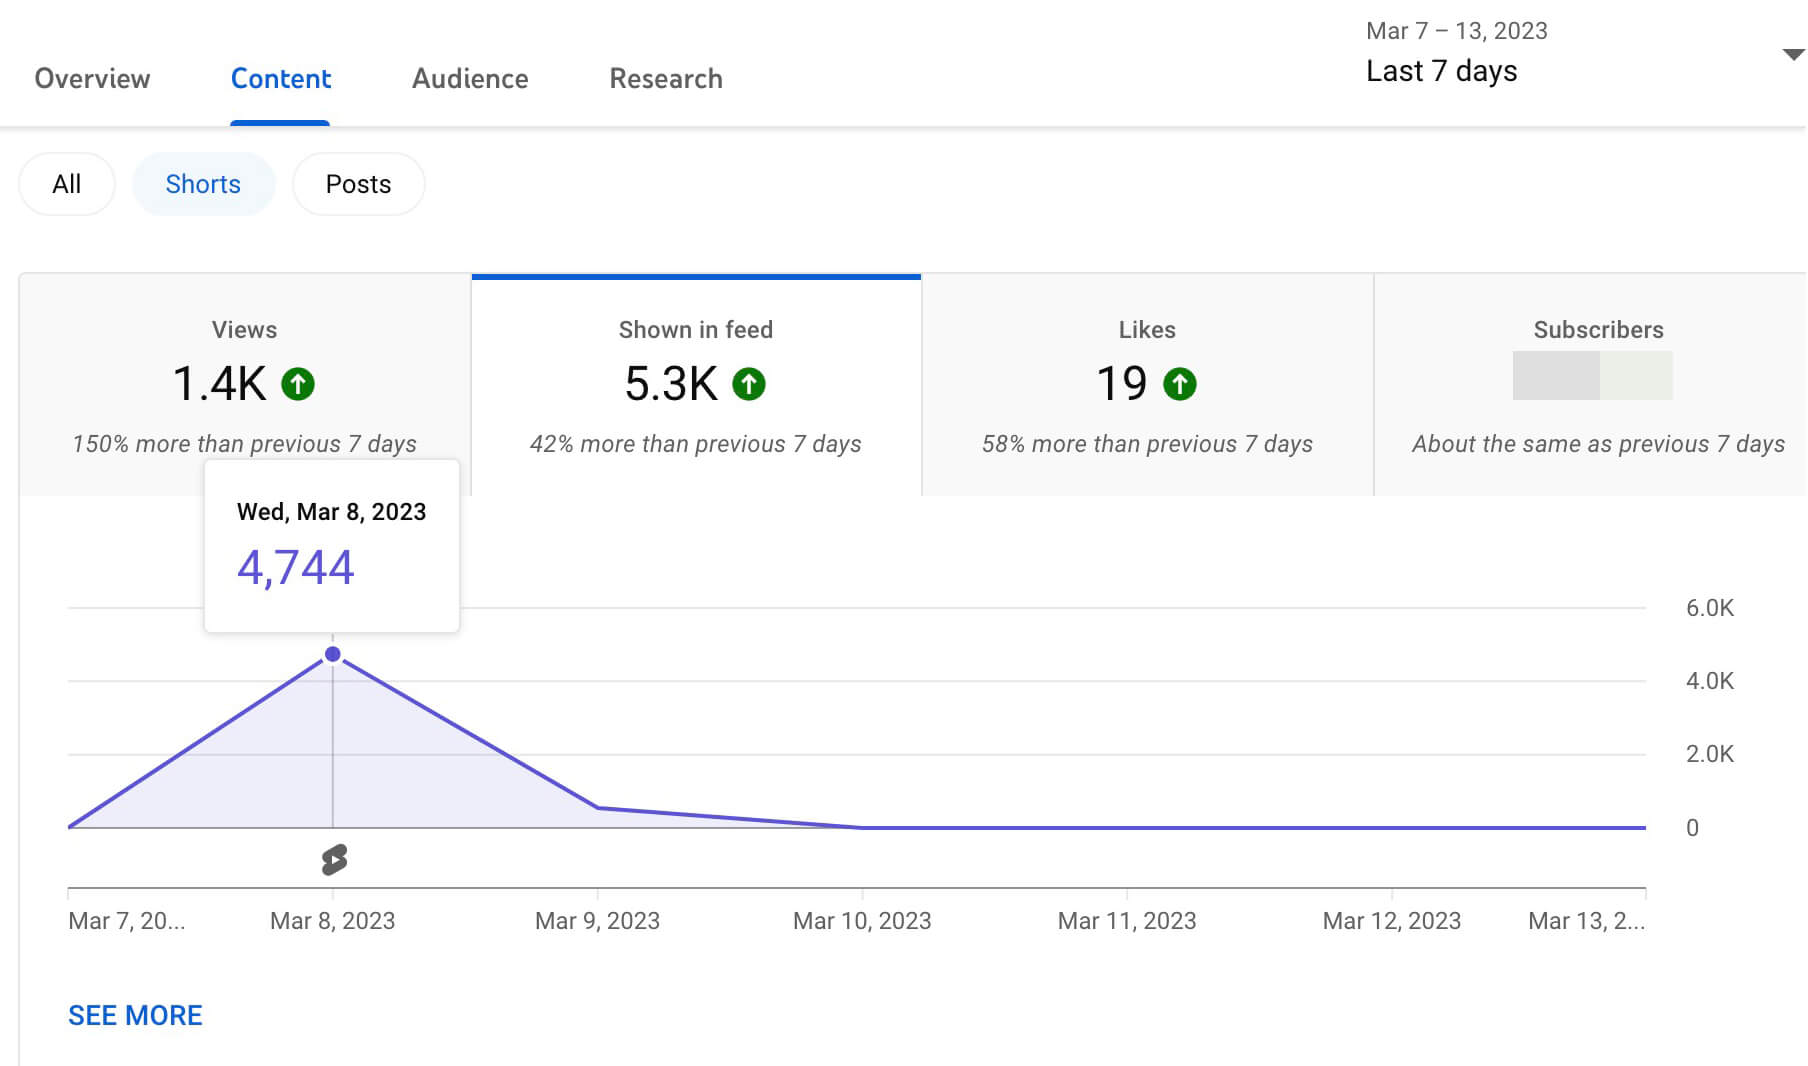
Since YouTube Studio automatically compares the Shown in Feed metric to the previous time period, it can help you assess whether your impressions are increasing or decreasing. If it reveals dramatic dropoffs, it can alert you to change course.
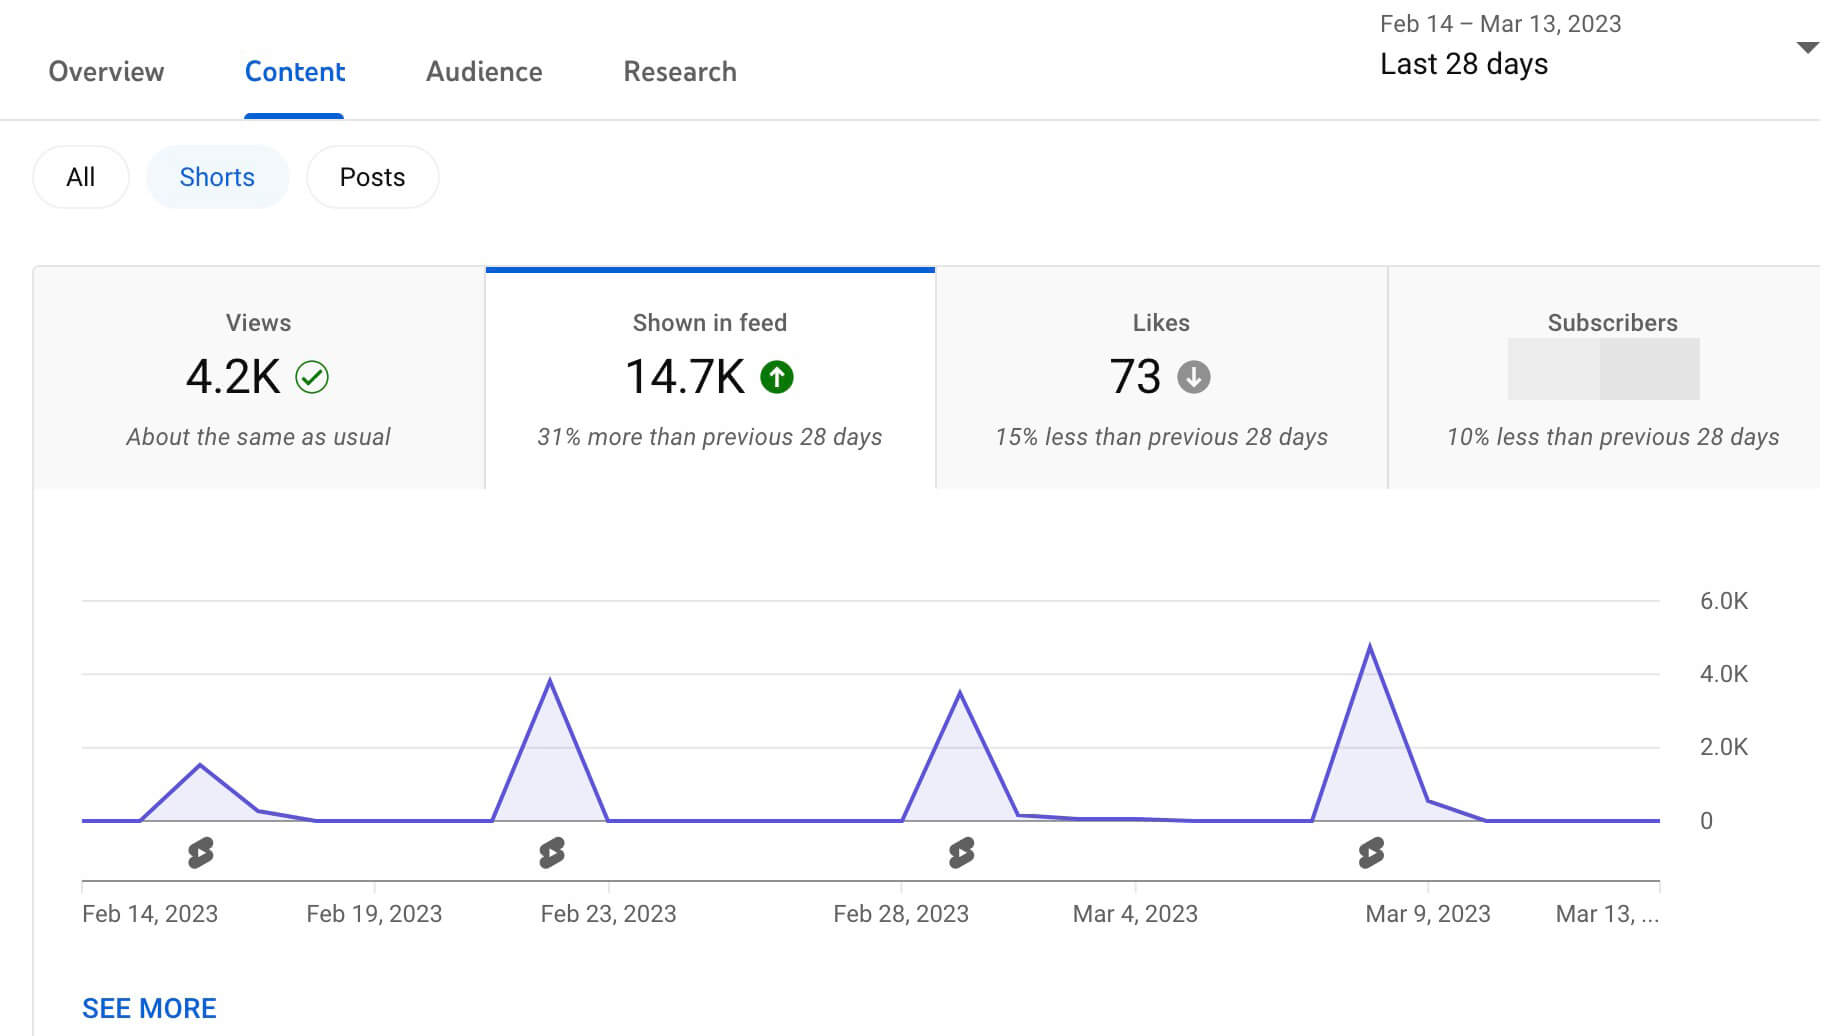
Yet it’s important not to zoom in on overly brief time periods, especially if you publish inconsistently or you only upload shorts once or twice a week. For a bigger-picture view, make sure to look at 28- and 90-day graphs.
Compare Shown in Feed Metrics to View Metrics
No matter which timeframe you choose to analyze, it’s critical to avoid looking at this metric in isolation. Are feed impressions important? Of course they are—but they’re even more valuable when you compare them to your channel’s view metrics.
To compare the two, select the Views tab and pay attention to the comparative data. Are your views increasing at the same rate as your impressions are growing? In the example below, impressions increased by about 40% while views increased by about 150%.
Which AI Moves Actually Matter?
That's what every marketer is wrestling with now. New AI strategies, new tools, new takes every week — but no clarity. Most marketers and business owners are trying to figure out AI alone.The AI Business Society is your trusted guide. Get expert-led training you can put to work immediately. Plus a community of marketers sharing what's actually working.
I'M READY FOR REAL AI RESULTS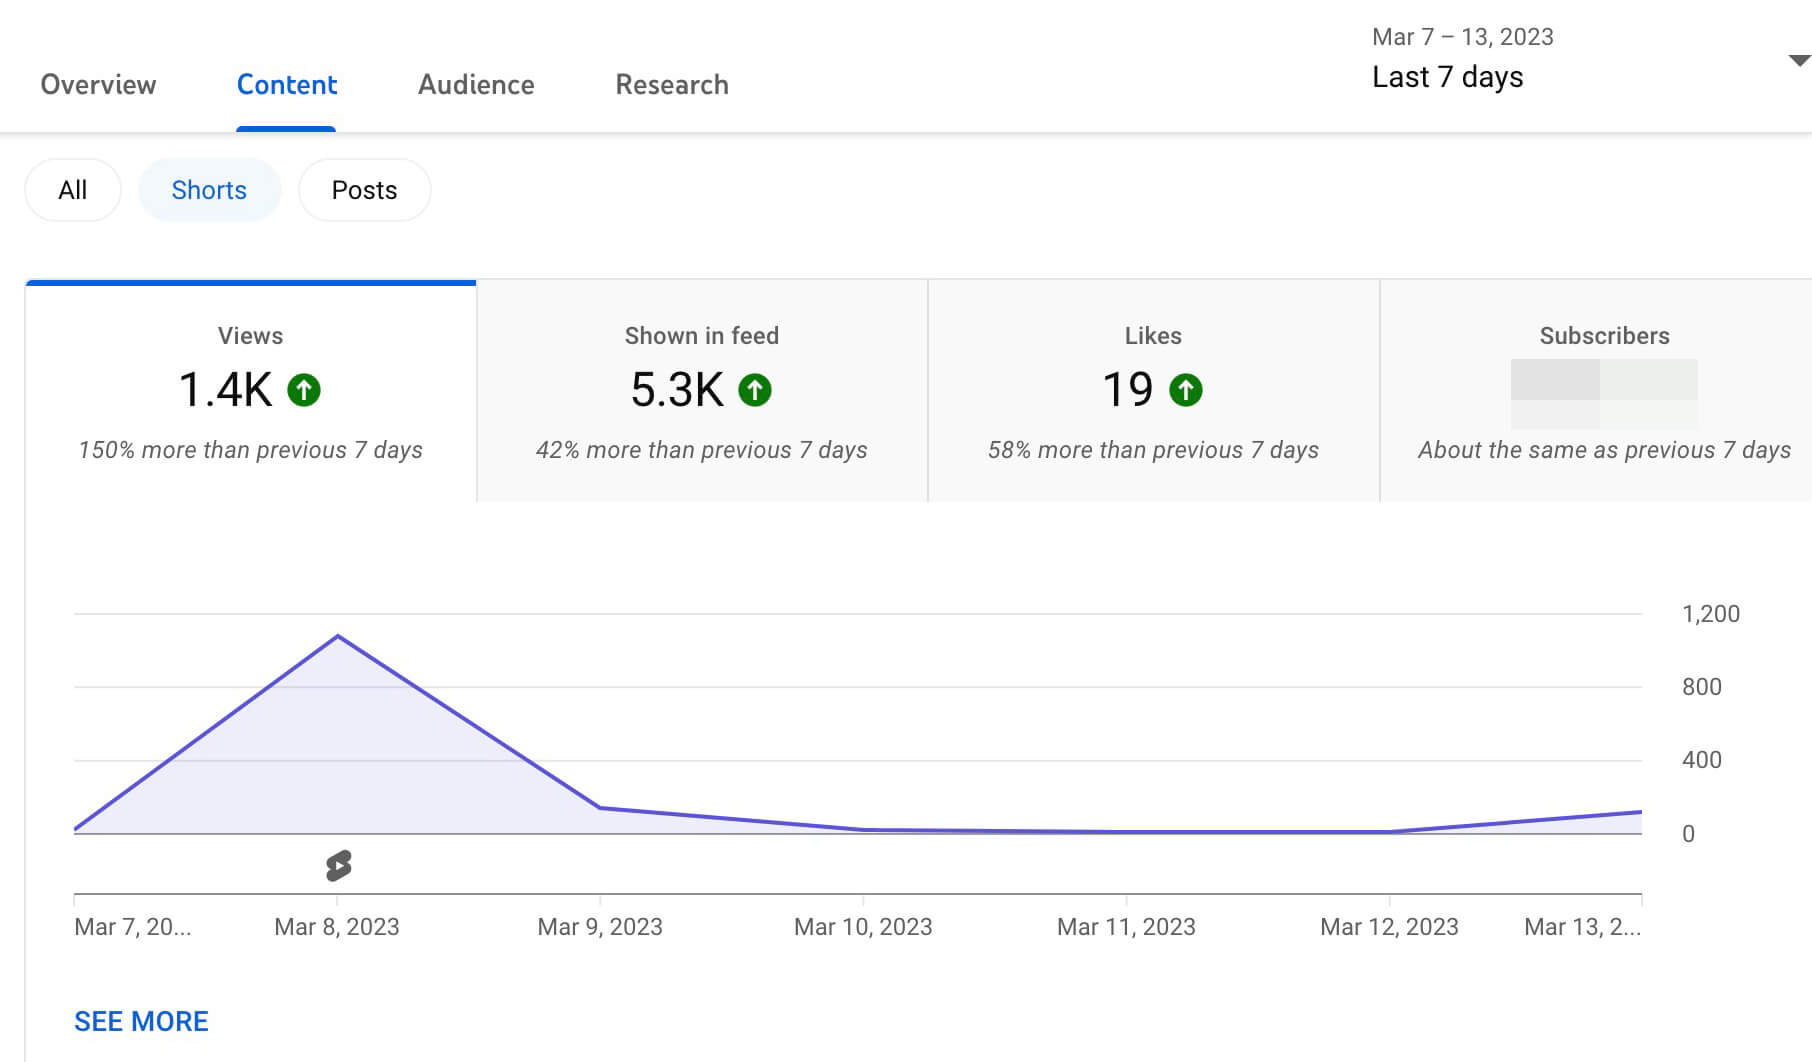
If views aren’t increasing nearly as quickly as impressions are, that’s a sign your shorts are succeeding in terms of factors like topical relevance and audience growth. Yet elements like video hooks may need some work before you can expect views to increase.
For more insights into your channel’s Shorts feed impressions, click the See More link to open YouTube Studio’s advanced analytics. Then select Views as the secondary metric. Now you can visualize how your channel’s views compare to impressions and chart the two metrics over time.
Compare Shown in Feed Metrics to Impression Metrics
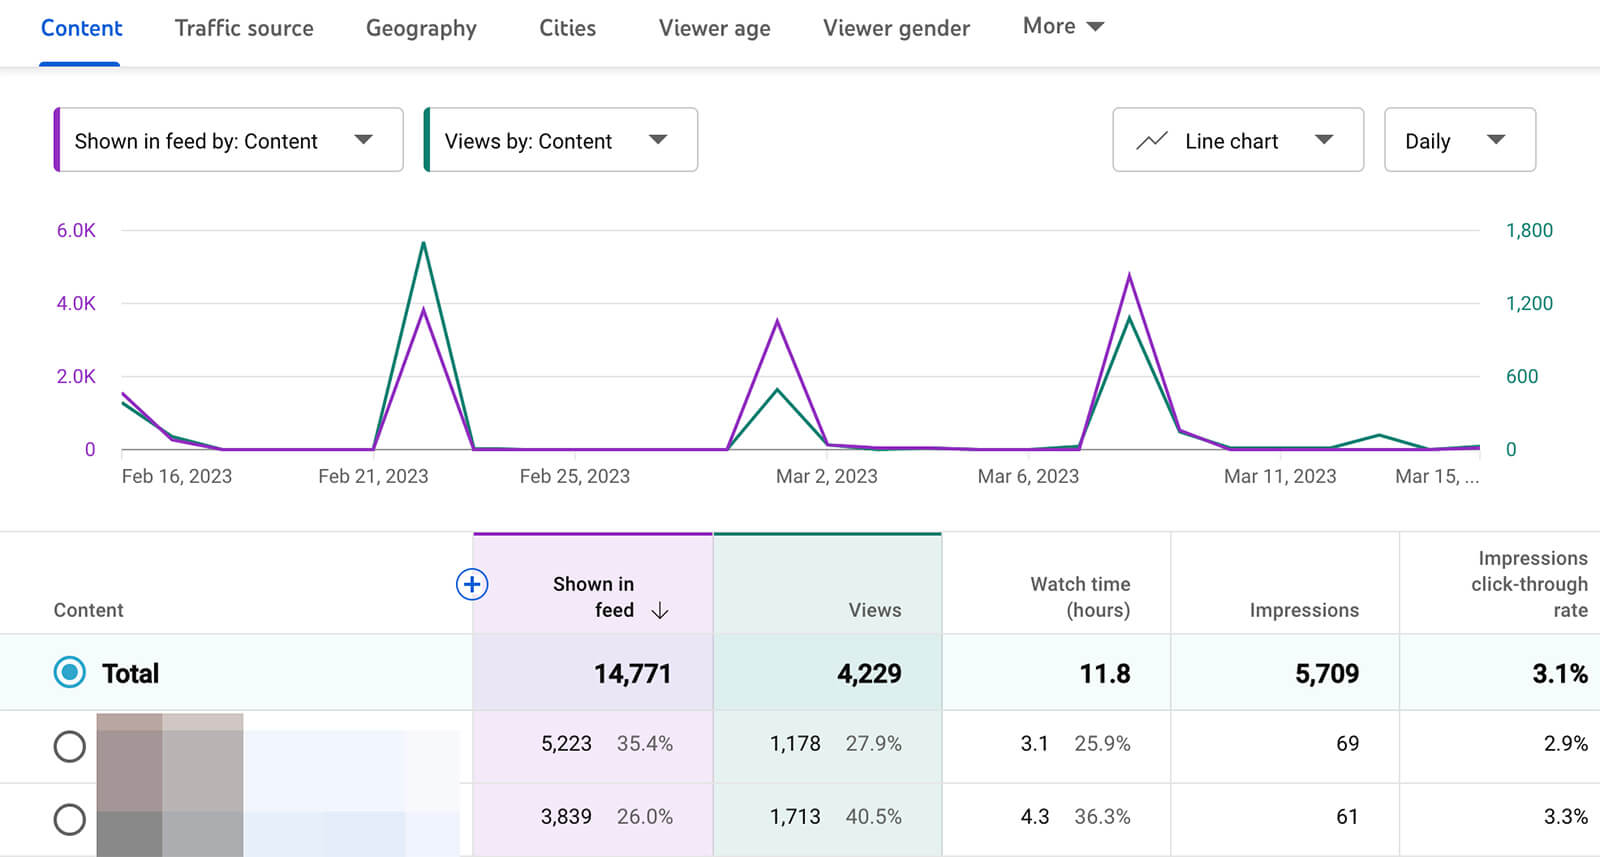
YouTube Studio’s shown in feed metric reflects performance in the Shorts feed only. So what about other opportunities for discovery? YouTube Studio’s impressions metric reflects the number of times viewers saw your video thumbnails in placements across YouTube, including the home page and search results pages.
By comparing impressions to shown in feed, you can get a better sense of where people are more likely to spot your content—and you can make a plan to address any underperforming areas.
For example, thumbnail impressions are typically driven by subscribers and searchers. If your thumbnail impressions are significantly lower than your Shorts feed impressions, it’s a good idea to prioritize audience growth and YouTube search engine optimization.
To compare these metrics, open YouTube Studio’s advanced analytics and add them as primary and secondary metrics. In the example above, most shorts generated significantly more Shorts feed impressions than thumbnail impressions.
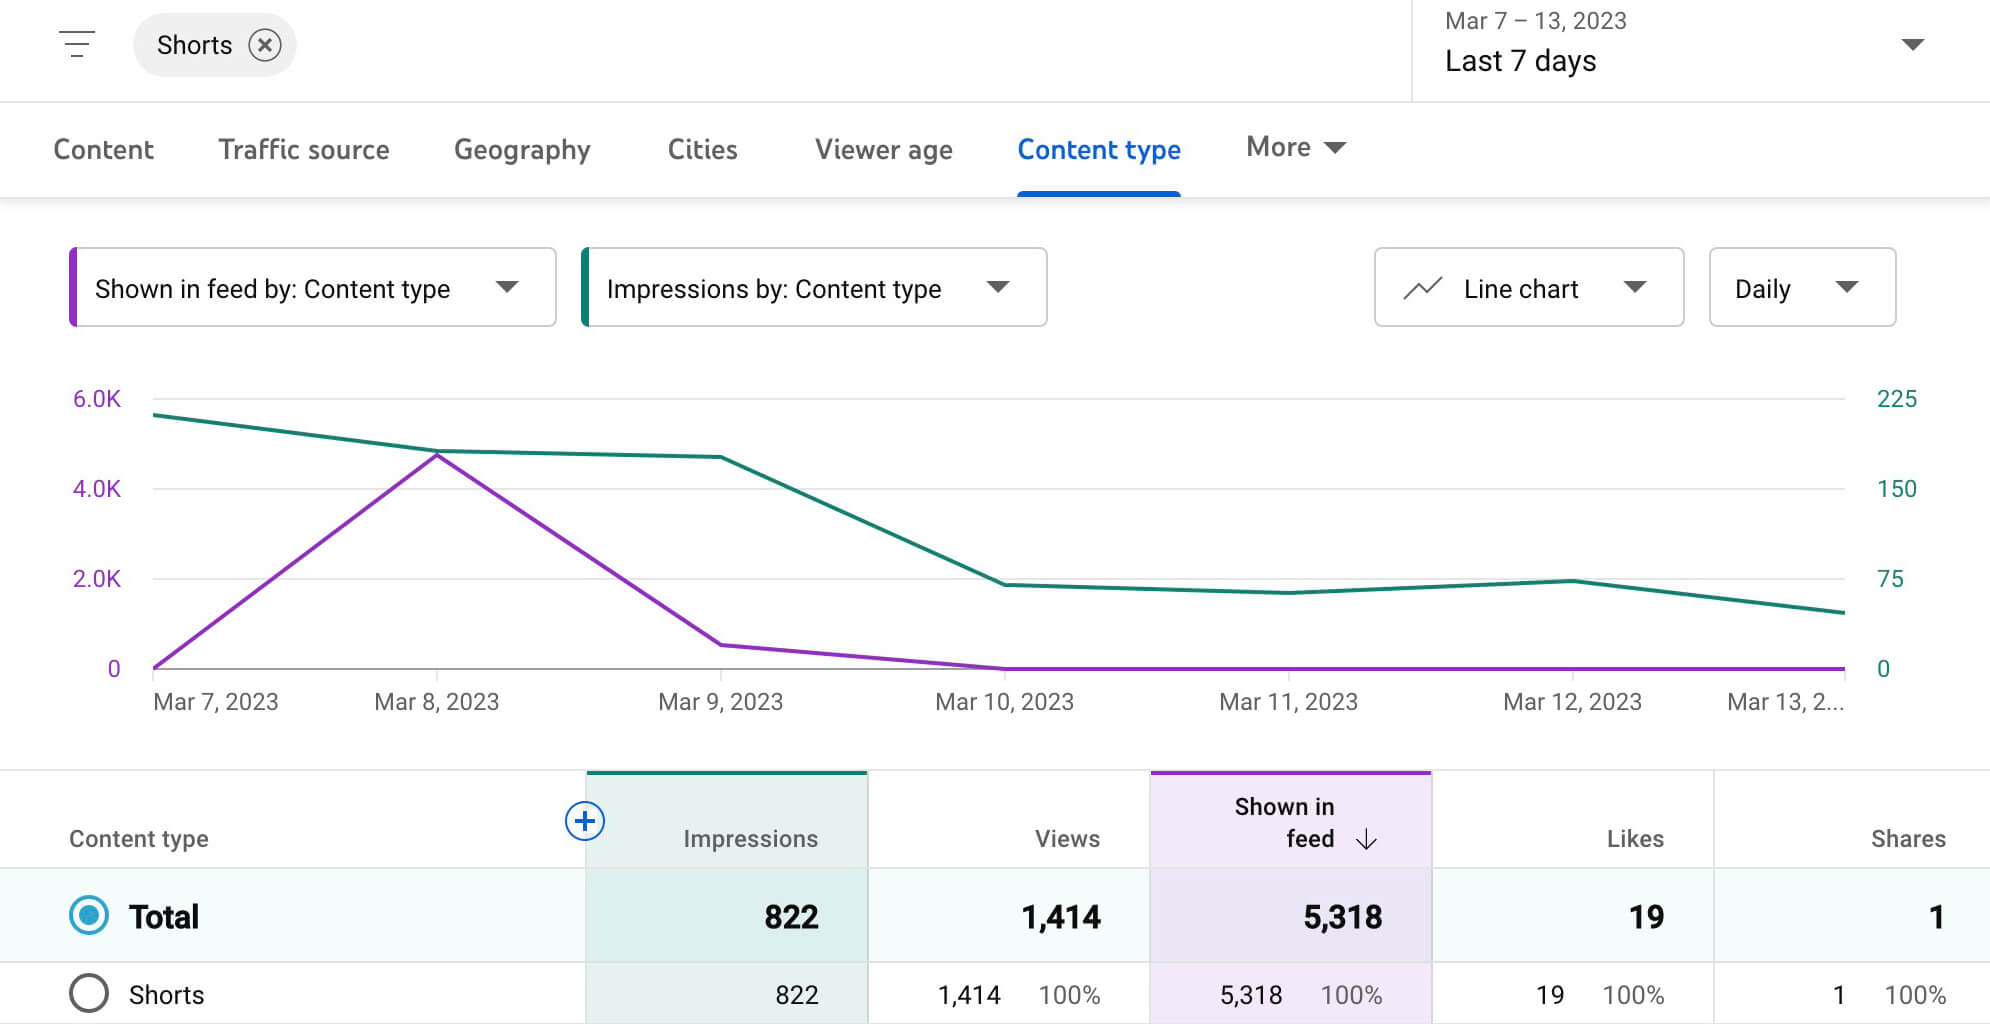
However, the oldest short that displays on the graph reflects the opposite result. To improve performance going forward, it would be helpful to identify what drove the higher thumbnail impressions for the oldest short (i.e., SEO) and incorporate those findings into future shorts.
Review Shown in Feed Metrics for Individual Shorts
Getting a channel-wide overview of your shown in feed metrics can be incredibly helpful for identifying trends and pinpointing potential issues. Yet it’s just as helpful to view shown in feed metrics for individual shorts.
To access these insights, select any short from the YouTube Studio content dashboard and go to the Analytics tab. Select Reach to see the shown in feed graph for the short you’ve selected.
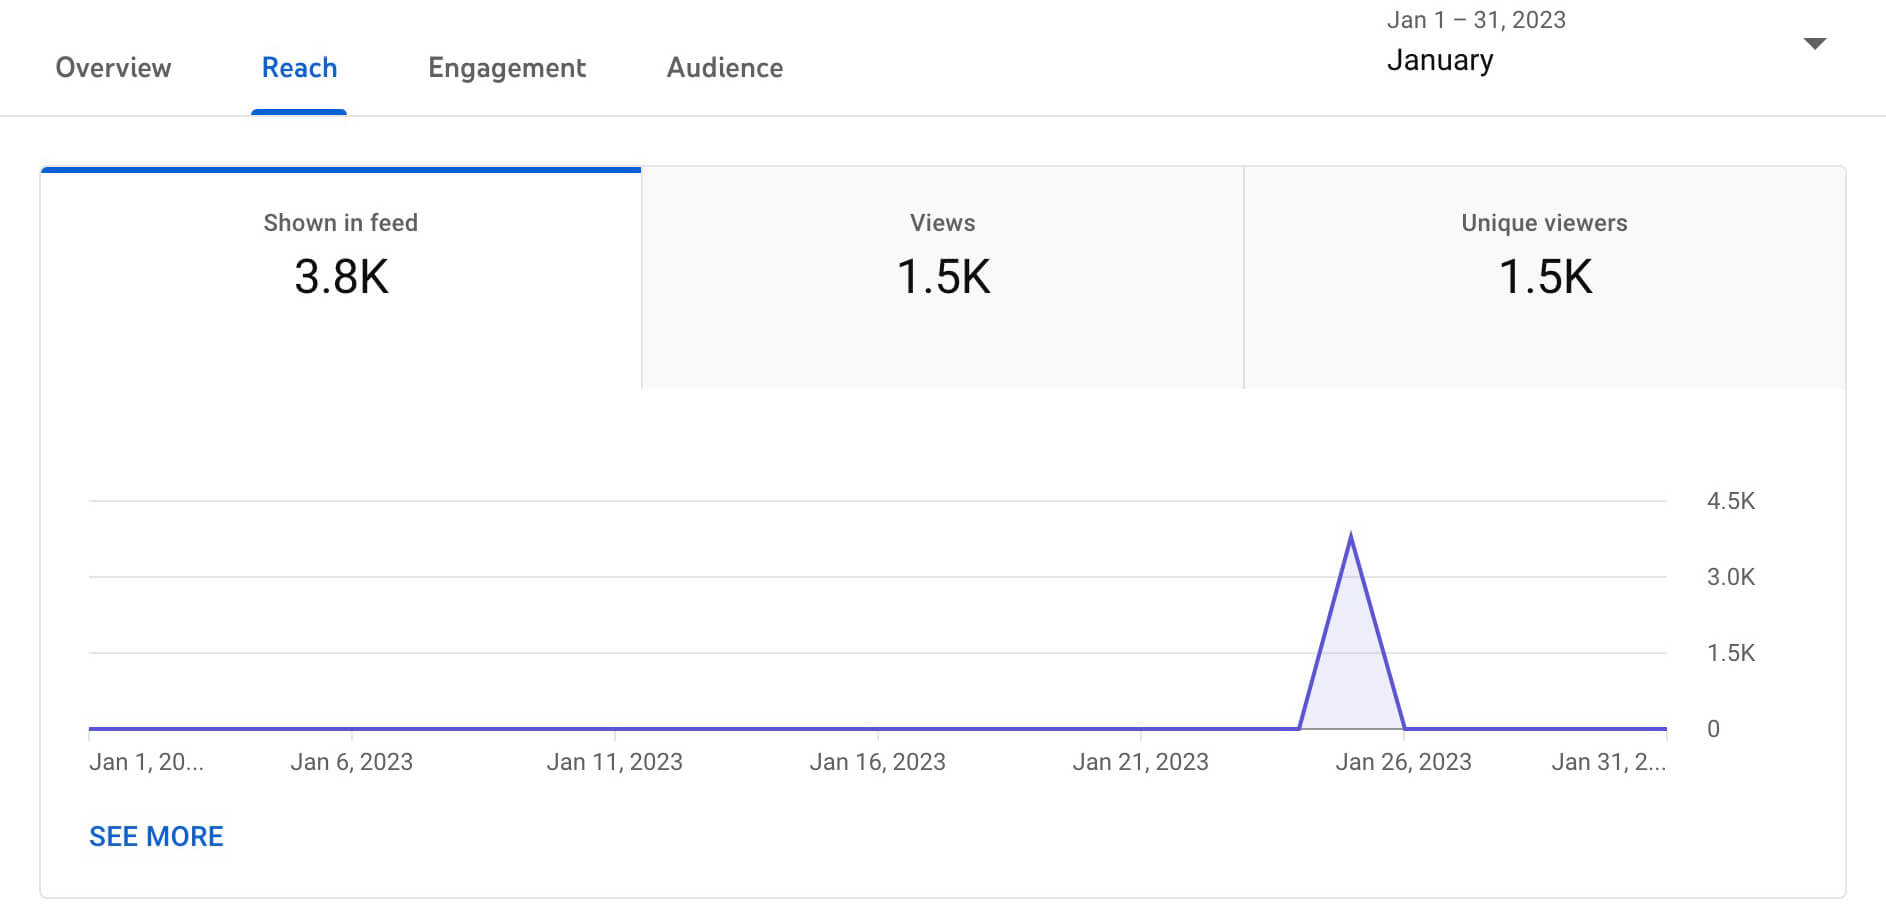
How do the video’s Shorts feed impressions compare to the views or thumbnail impressions? Click the See More link to open a customizable graph. Similar to the channel-wide graph, this option also allows you to choose multiple metrics to view simultaneously for comparative purposes.
Evaluate All Short-Form Content for YouTube Shorts Feed Impressions
Have a lot of shorts to analyze? You don’t necessarily have to click through and evaluate them one by one. Instead, you can use YouTube Studio’s advanced analytics to compare all of your content at once.
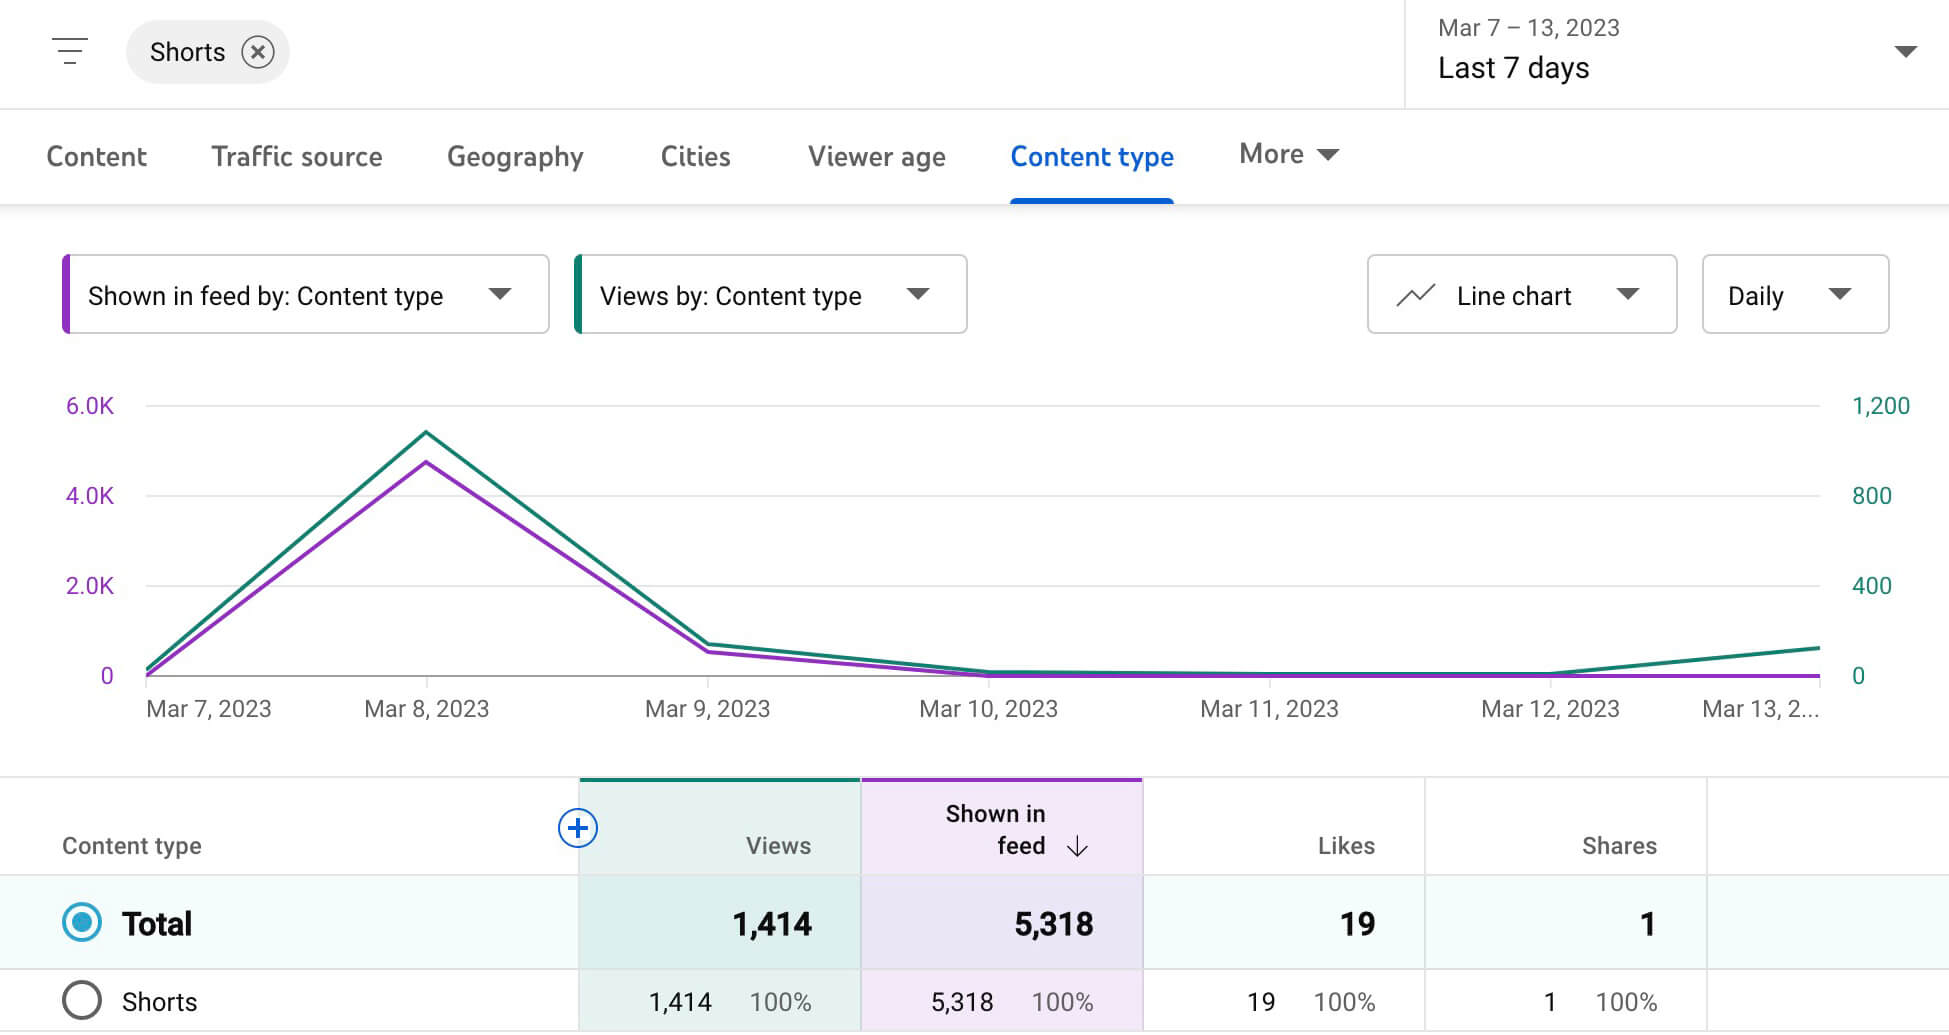
Click any See More link in YouTube Studio to open advanced analytics. Then select the Content tab and choose a timeframe. Select Shown in Feed for the primary metric and choose any relevant metric as a secondary option, like Views or Impressions.
Now you can easily chart impressions in the Shorts feed and sort individual short-form videos by this metric. Which videos appeared most in the Shorts feed? How do they compare in terms of views, impressions, watch time, and other metrics that matter to your team?
3 Days of World-Class Training—Zero Travel!

Couldn't make it to Social Media Marketing World and AI Business World this year? Get all of the great content at a fraction of the price with a Virtual ticket.
That’s full access to recordings of every keynote, workshop, and session—the ones people travel thousands of miles to see. Don't wait. Get your Virtual ticket and enjoy actionable content that you can watch anytime, anywhere.
#2: How to Analyze YouTube Shorts View Rates
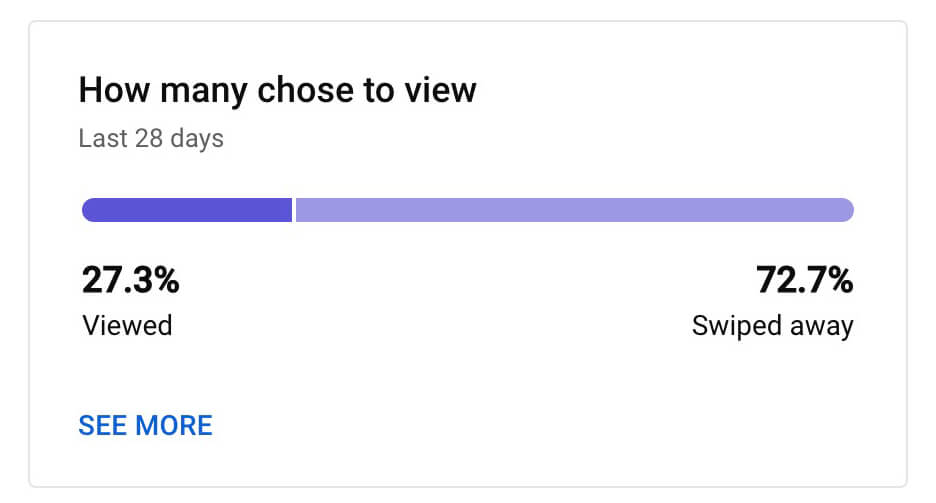
Between YouTube Studio’s views and shown in feed metrics, you can estimate the view rate for your shorts. But there’s no need to do the math, as YouTube Studio now displays it on the How Many Chose to View panel. You can find this panel directly under the Shown in Feed chart on the Content tab for your channel.
This panel looks simple. But it’s crucial for understanding whether the viewers who see your content in the Shorts feed opt to keep viewing or if they swipe away to the next short-form video instead.
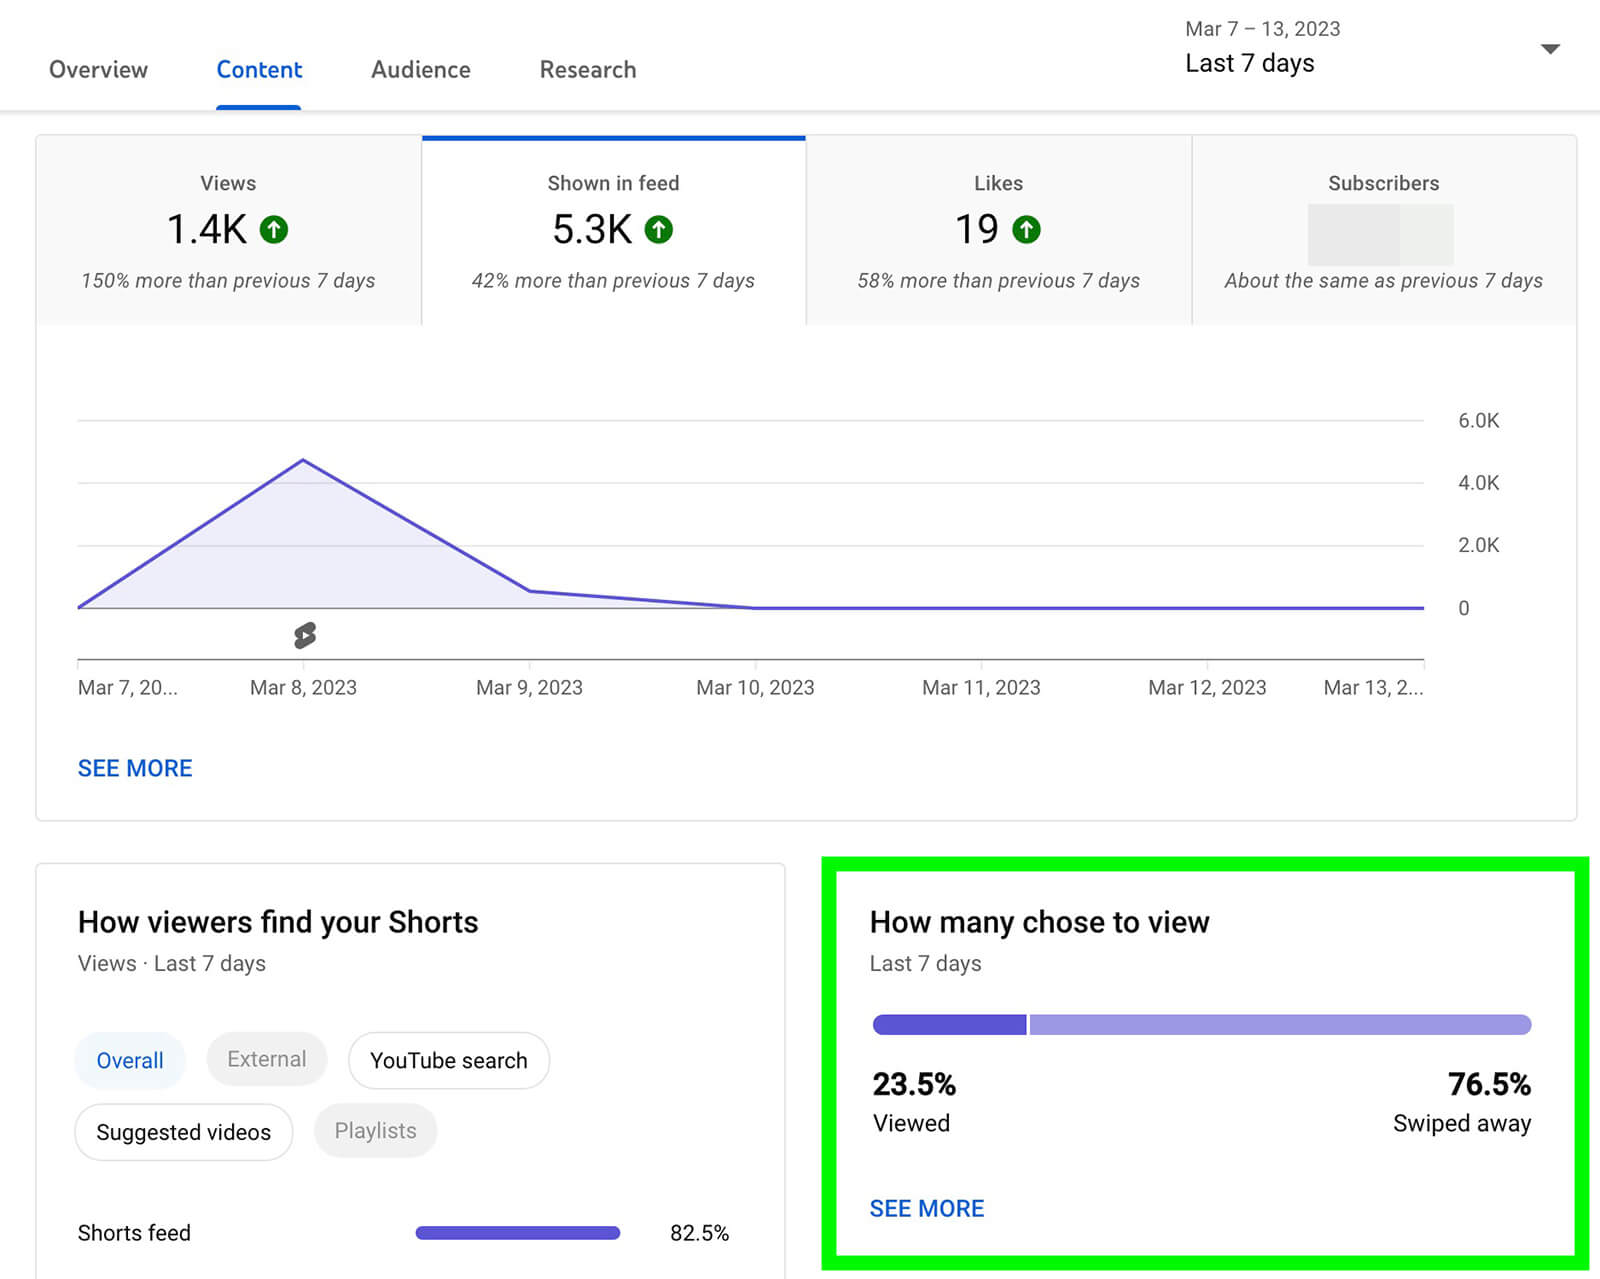
Ideally, the Viewed percentage will be higher than the Swiped Away percentage. This ratio would suggest that your content successfully hooks viewers and gets them to keep watching.
But above all, it’s important to establish a benchmark for your channel and use that as a guideline. For example, this channel’s 90-day ratio is 26.6% viewed versus 73.4% swiped away. Compared to the channel’s 28-day metrics, it’s maintained a relatively stable view rate over time.
Check View Rate for Individual Shorts
Above, you can see how Shorts view rate metrics work at the channel level. Like Shorts feed impression metrics, however, Shorts view rate metrics are available at the content level.
To access content-level view metrics, select any short from your content dashboard. Go to the Reach tab and look for the How Many Chose to View panel, directly under the main reach graph.
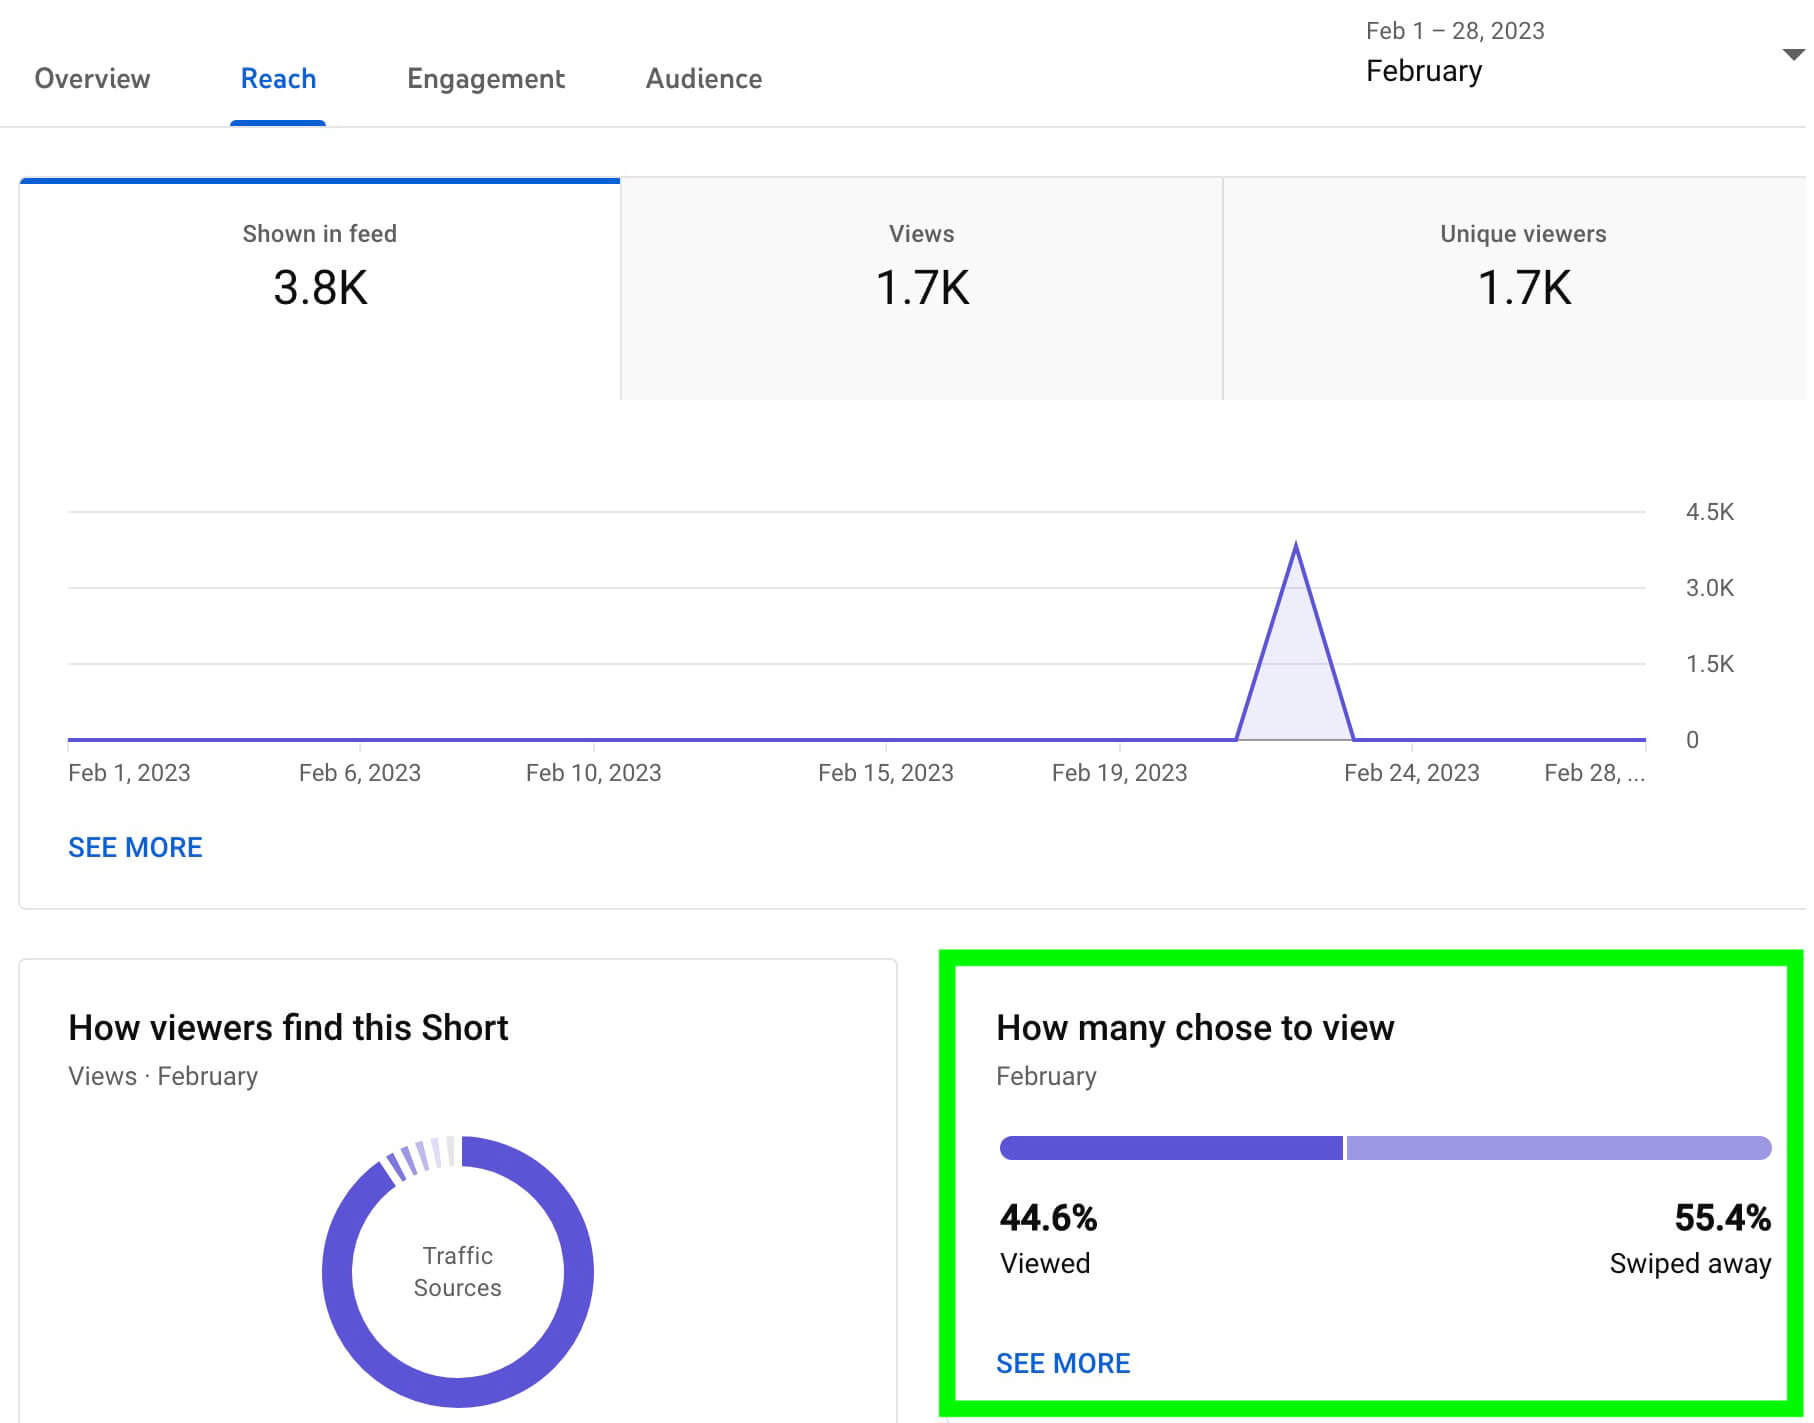
Do some of your YouTube shorts have particularly high view rates, like the one pictured above? Review the content to identify the elements that contributed to its success. Did you experiment with a new hook? Did you test a new topic? How about a new aesthetic or audio track? Keep these factors in mind as you plan future content.
Analyze View Rate Across Shorts Content
Similar to Shorts feed impression metrics, Shorts view rate metrics can also give you an overview of all of the content you’ve published on your channel. To access this data, click the See More link to open YouTube’s advanced analytics.
If you choose Viewed (vs. Swiped Away) as the primary metric, you’re likely to see a lot of shorts with 100% view rates but very few total views. For a more balanced look at this metric, set Viewed (vs. Swiped Away) as the secondary metric. Then choose Views or Shown in Feed as the primary metric.
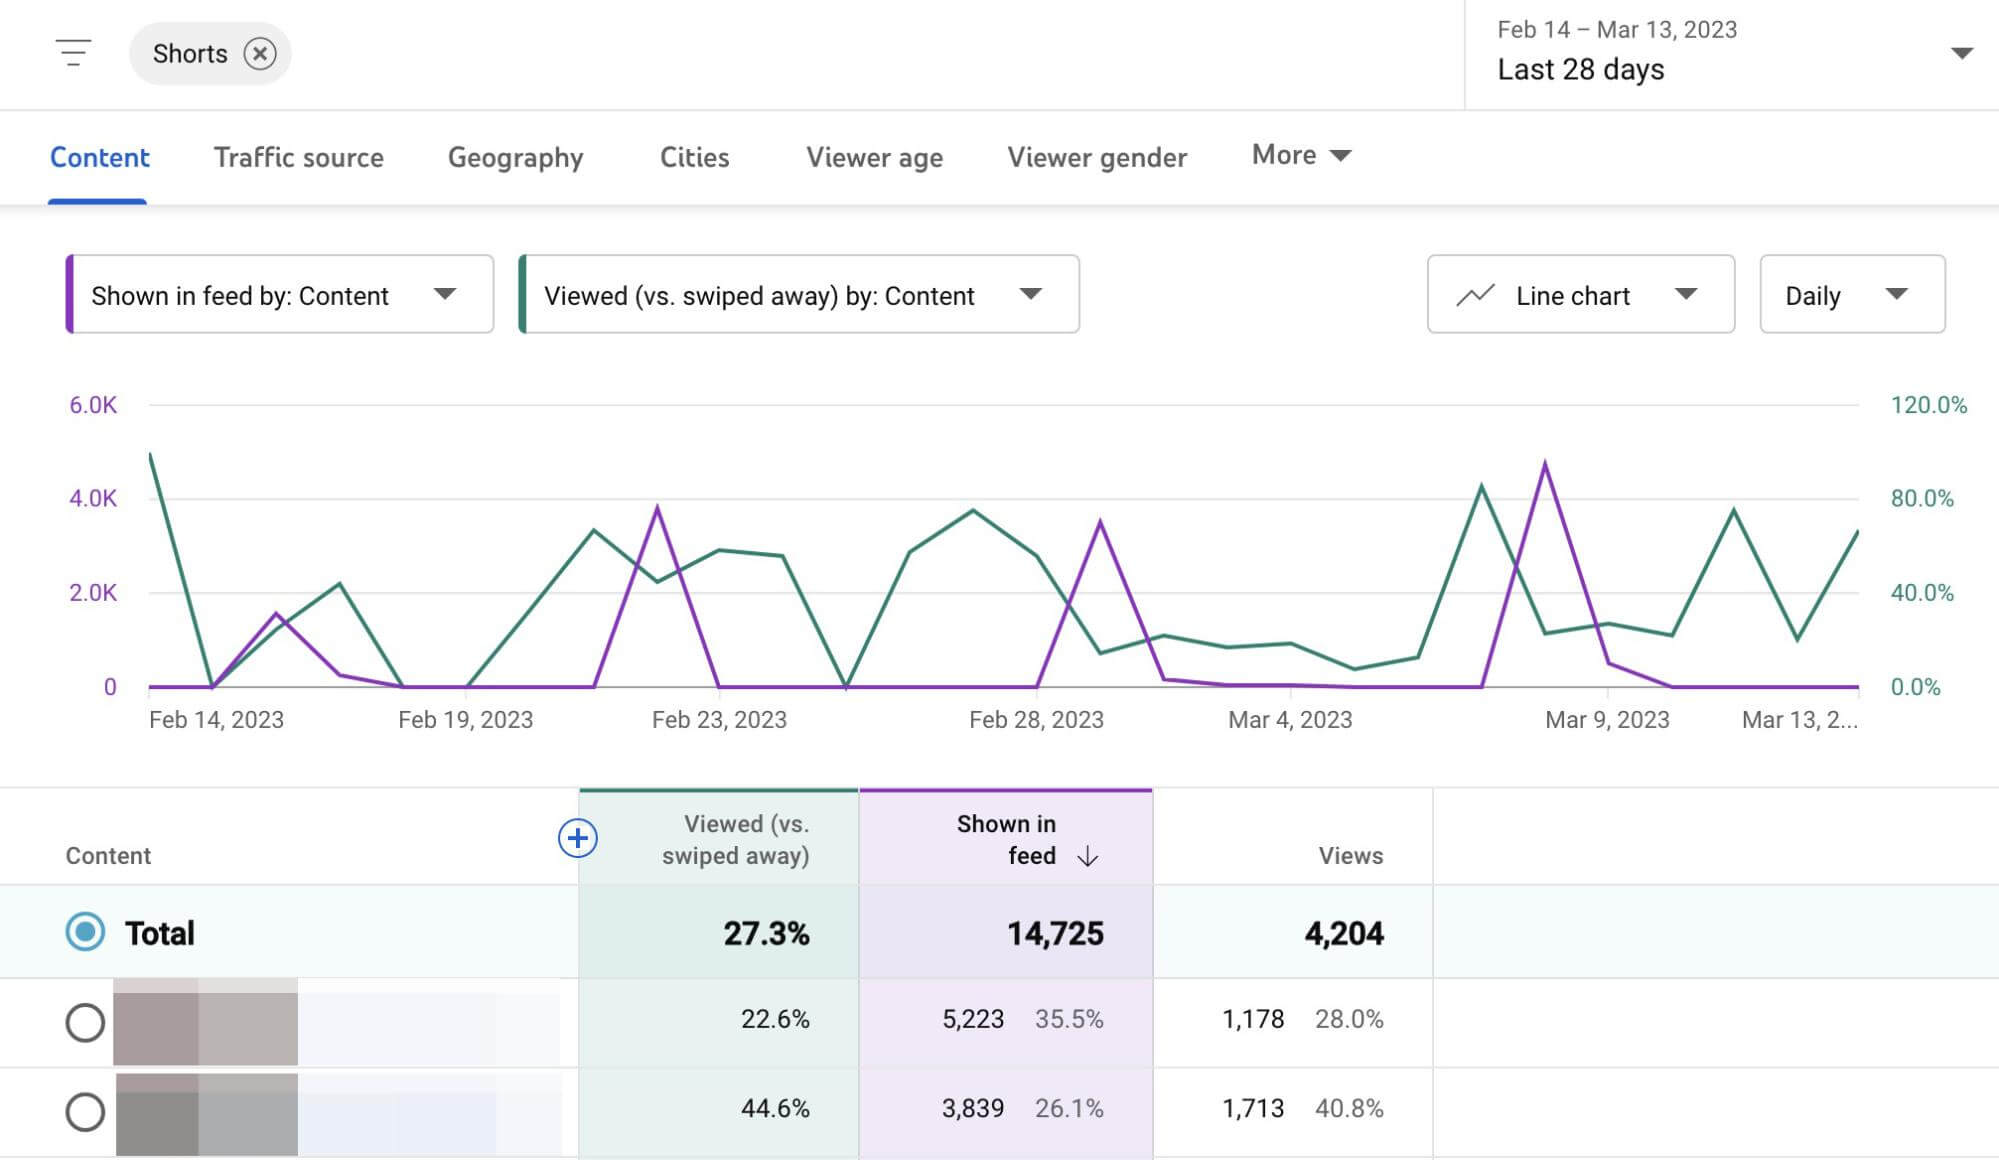
Now you can see which shorts had the highest view rates in the context of total views and Shorts feed impressions. Pay attention to the shorts that had the highest view rates and the highest view numbers or Shorts feed impressions. What made them stand out and get viewers to watch? How can you incorporate these elements into future short-form videos?
Factor in Audience Retention Metrics
View rates help identify content that successfully grabbed your audience’s attention. However, YouTube hasn’t clarified what counts as a view versus a swipe. It’s likely that a view reflects a certain amount of watch time, such as a 3-second view.
That’s why it’s helpful to factor audience retention metrics into your Shorts analysis. Audience retention metrics aren’t new for Shorts but they can help you get a more complete picture of how valuable your views are and what views mean for your channel.
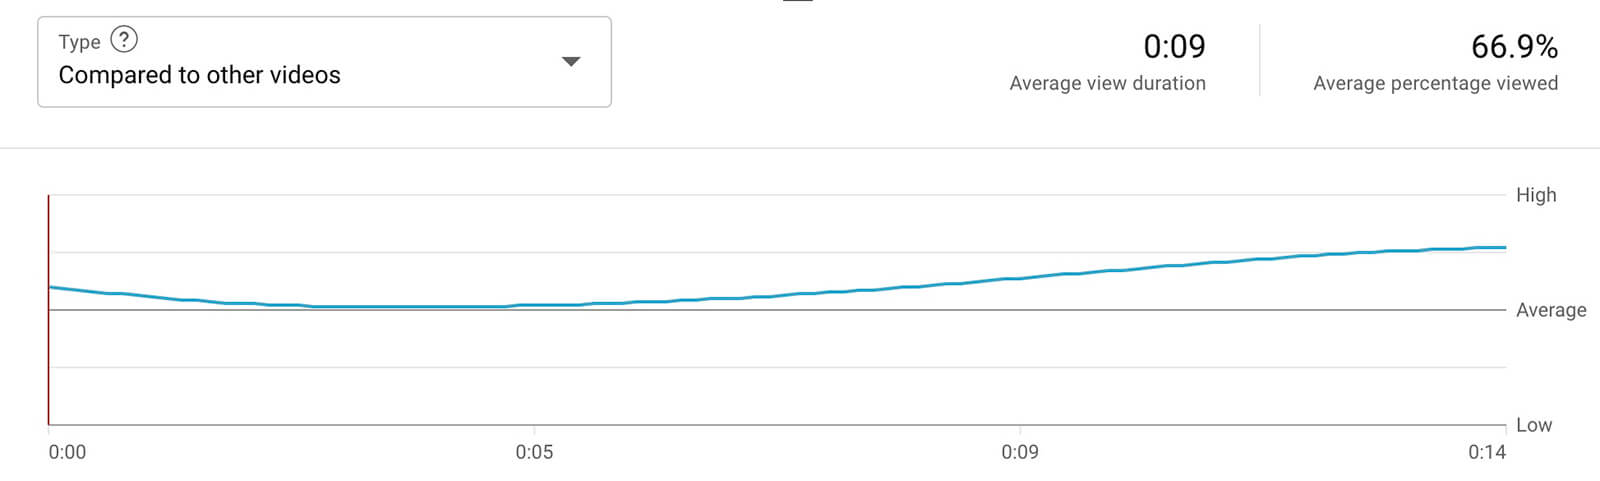
You can access audience retention metrics at the content level for any short you’ve published. YouTube Studio displays the average view duration and average percentage viewed for each video alongside a chart that shows when viewers tend to click away.
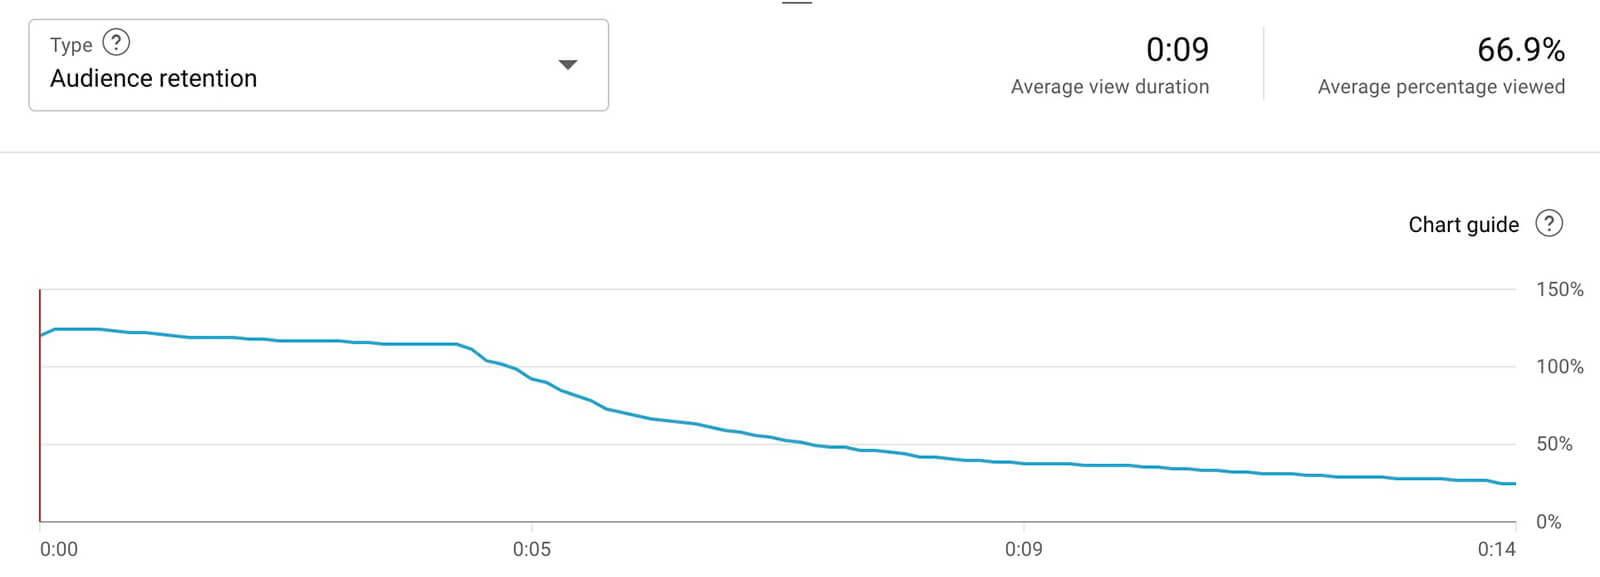
Select Compared to Other Videos to get an even more complete picture of how your short measures up. Here, you can see whether audience retention is high, low, or average throughout the length of the short.
For more comparative data, open advanced analytics for your shorts. Select Average Percentage Viewed as the primary metric and Viewed (vs. Swiped Away) as the secondary metric. In many cases, you might find that shorts with higher view rates also had better audience retention. Since these shorts check both boxes, they can be good models for future content.
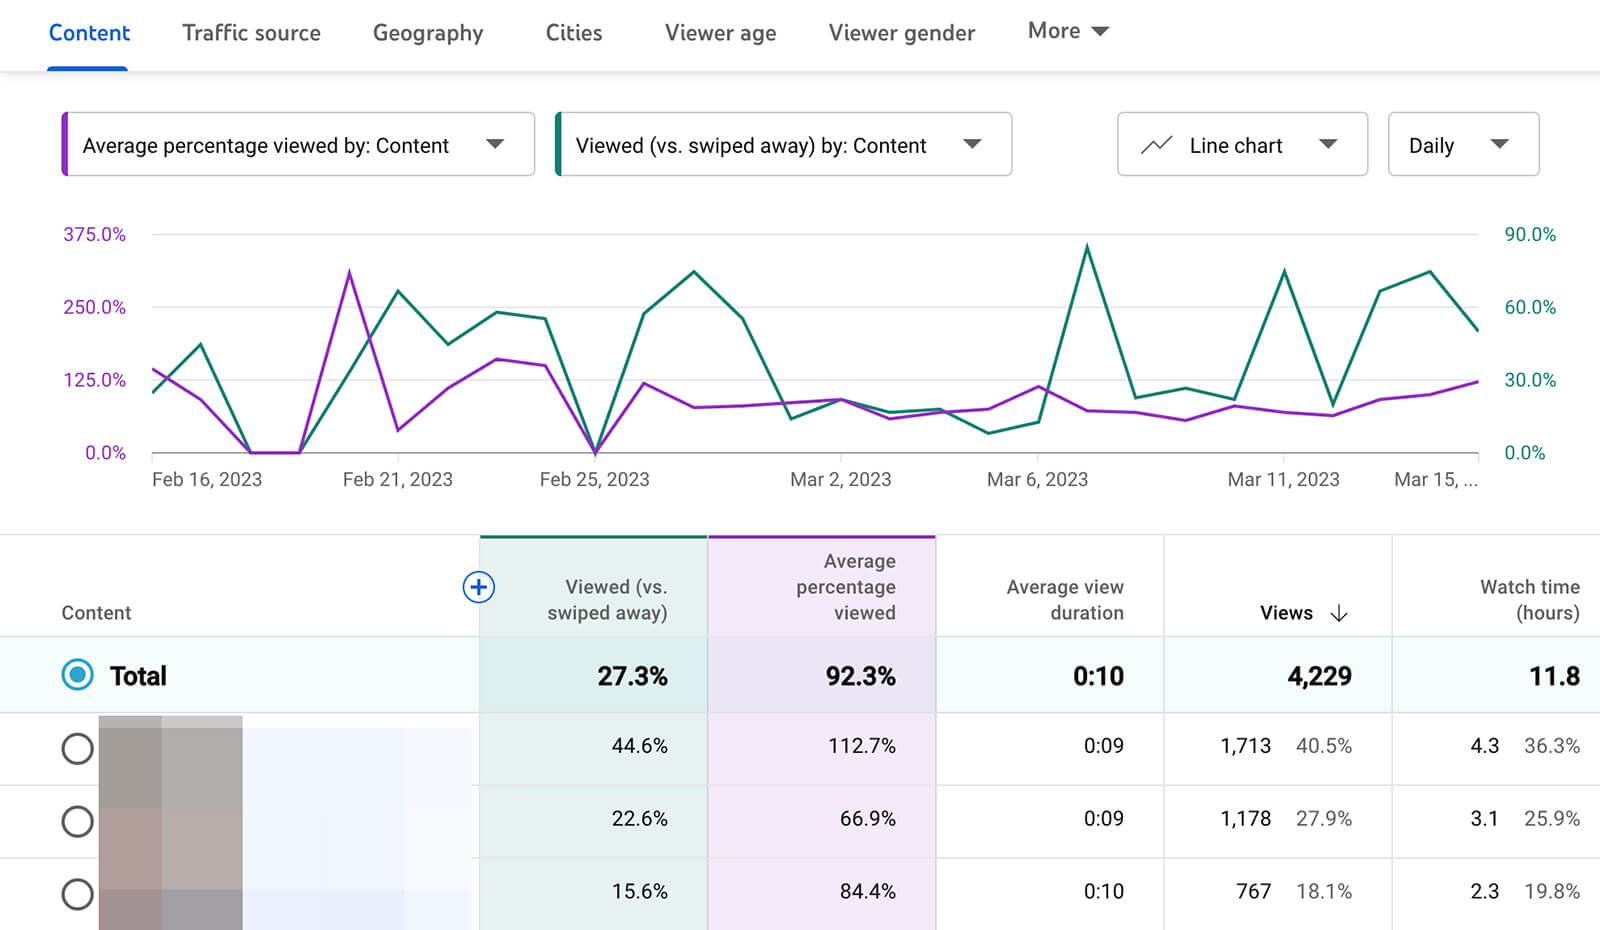
But in other cases, you might see that shorts with low view rates outranked others in terms of audience retention. If these shorts had better hooks, would they have higher view rates, which could have increased audience retention across the board?
Using these insights and relevant lines of questioning, you can give audiences what they want to see and continue to improve your channel’s Shorts content, ultimately leading to better results for your channel.
#3: Review Audience Demographic Analytics for YouTube Shorts
Audience analytics aren’t new for YouTube Shorts but the ability to zero in on Shorts viewers is. Why does that matter for your shorts’ performance? The viewers who watch your long-form content may not be the same as the viewers who watch your short-form content. If you know who’s watching different types of content, you can make it more relevant to their needs and interests so you can improve performance.
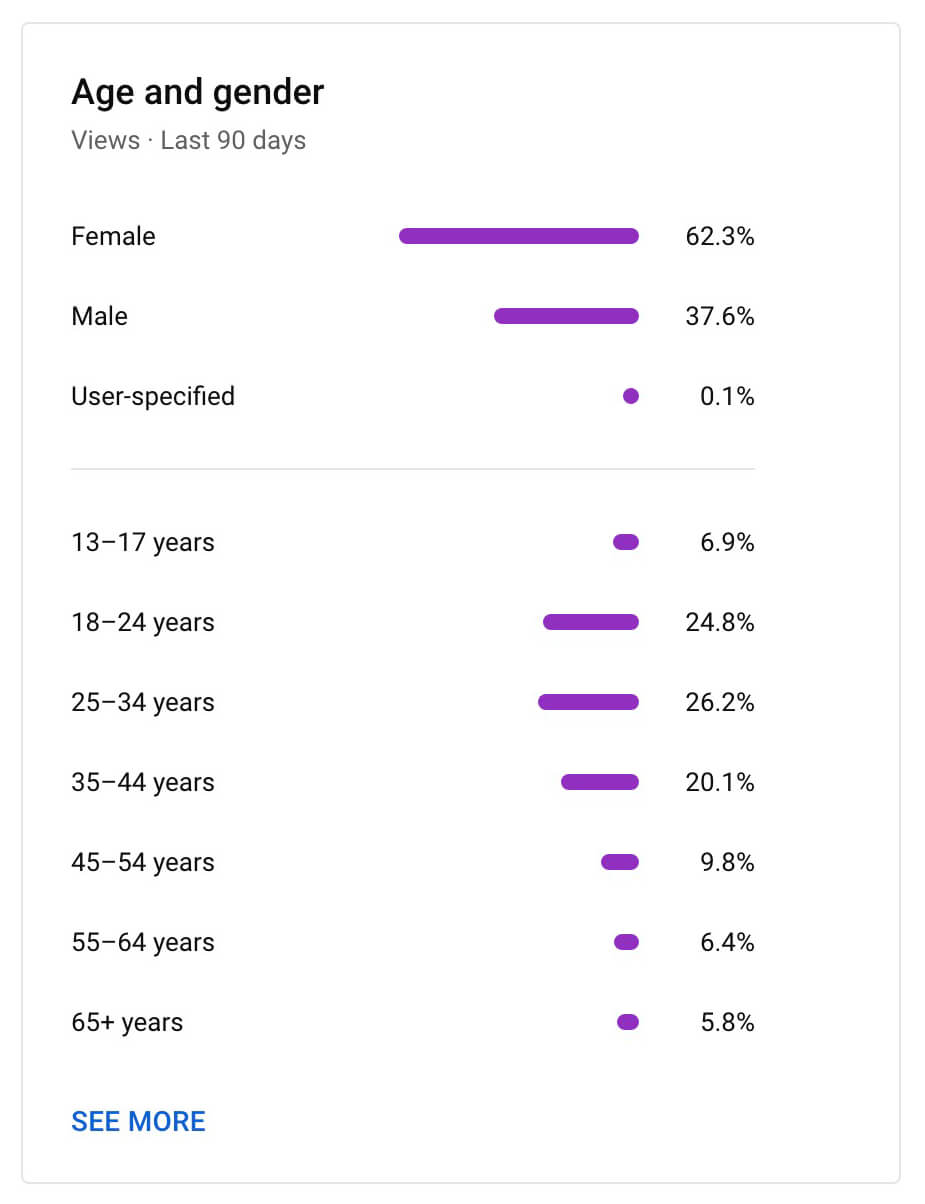
To access this audience data, open YouTube Studio analytics and go to the Audience tab. Scroll down to the Age and Gender panel. If you publish a mix of shorts and long-form content, you’ll see chips at the top of the panel that allow you to view analytics for viewers of that content type only.
No matter what kind of content mix your channel has, you can dig into the details by clicking the See More link.
With advanced analytics, you can filter by content type (i.e., Shorts) and see how different audience segments affect various metrics.
For example, you can view age and gender data for shorts views and watch time.
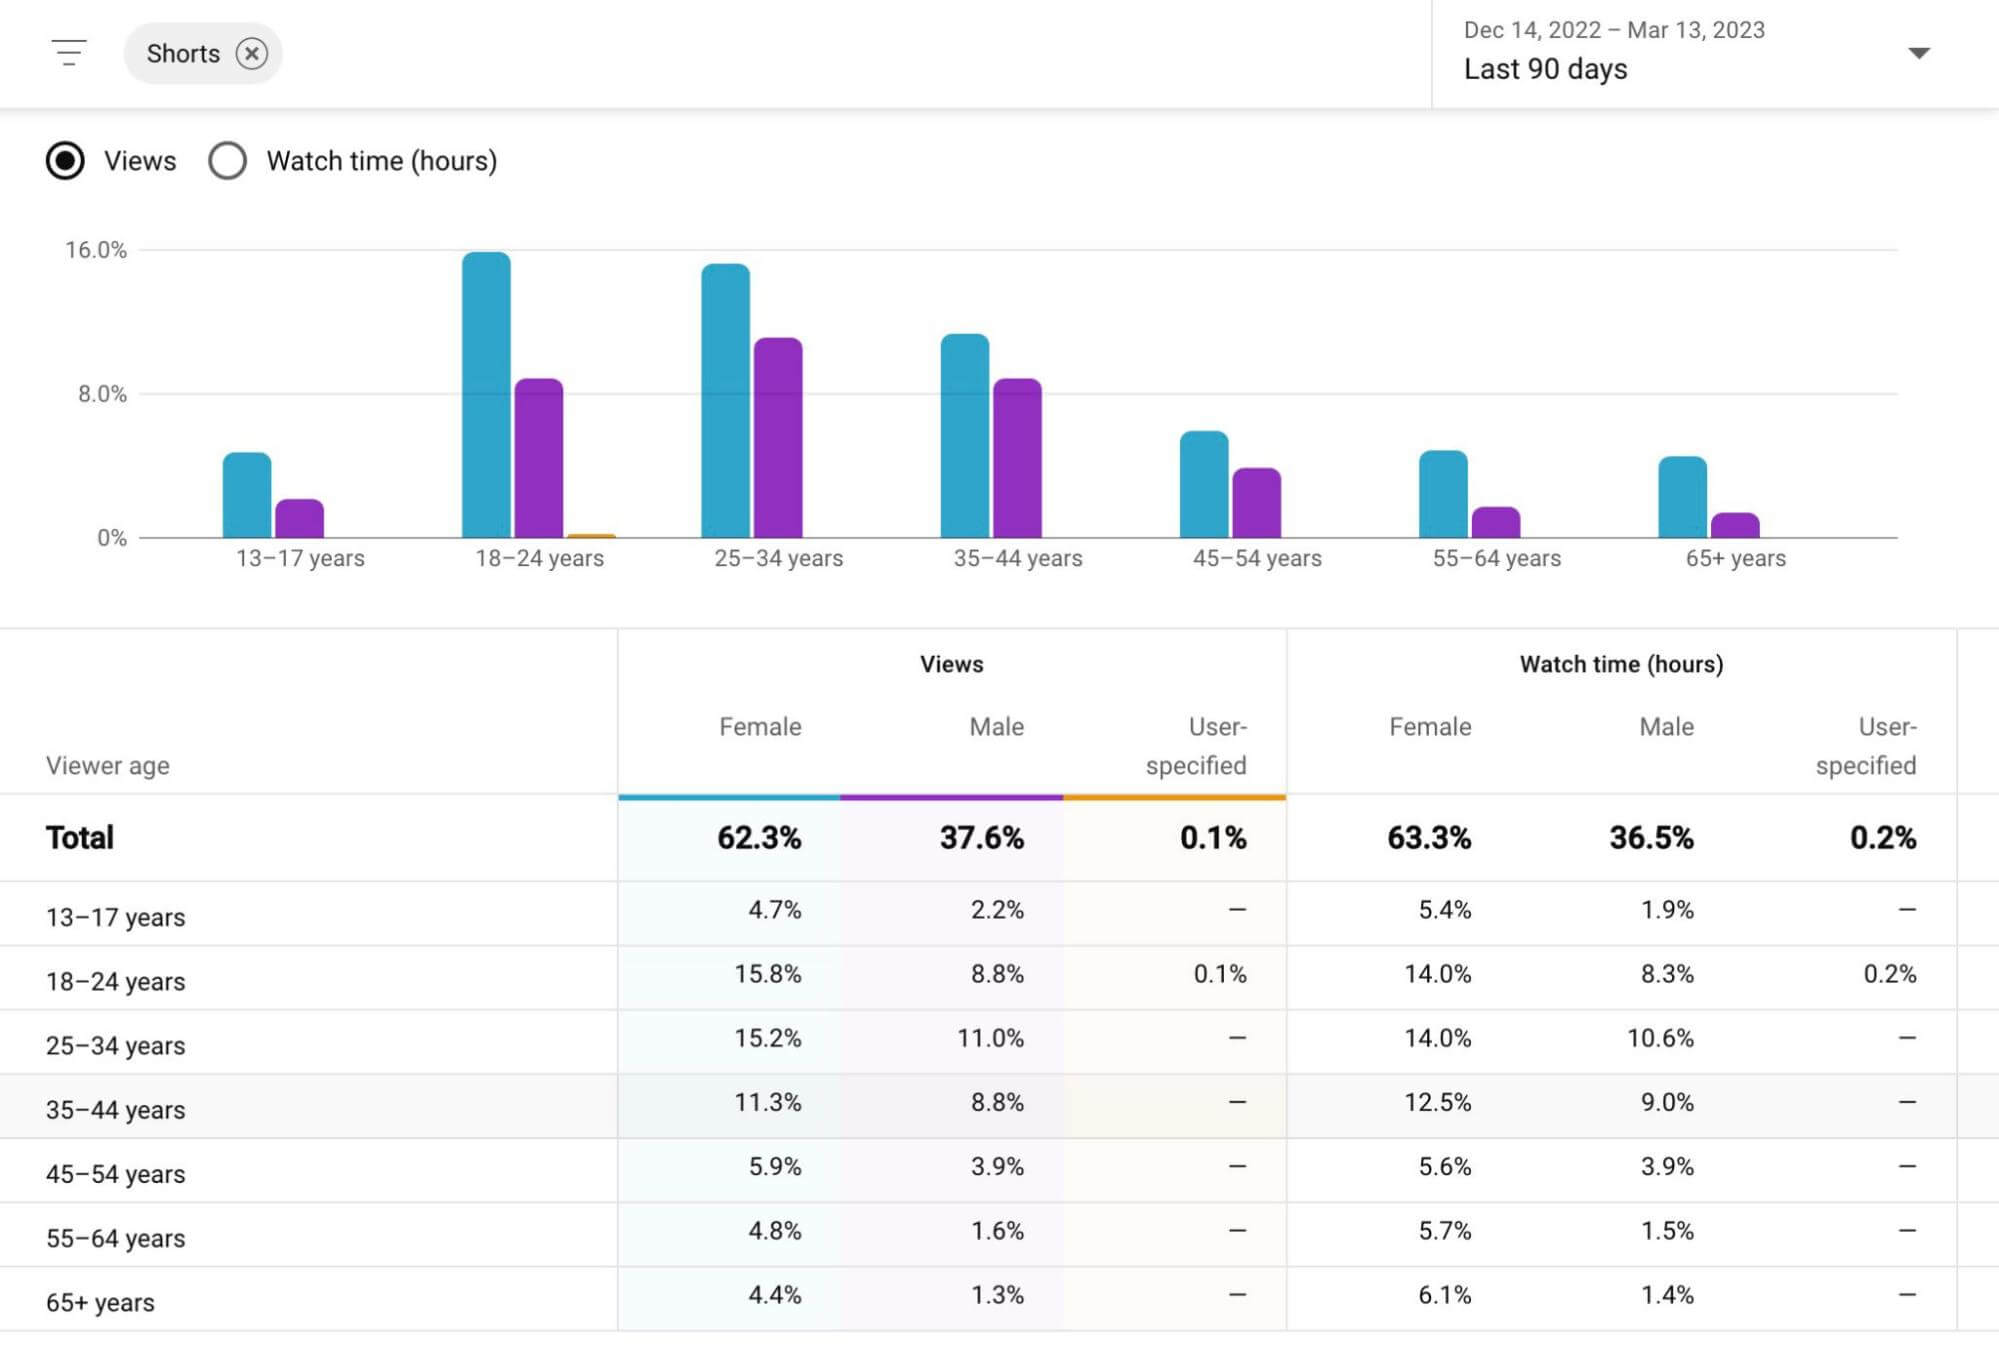
Do some audience segments log more views or spend comparatively more time watching your content? If so, it’s a good idea to think about how you can create shorts that are even more tailored to these segments, especially if they differ from your long-form audience.
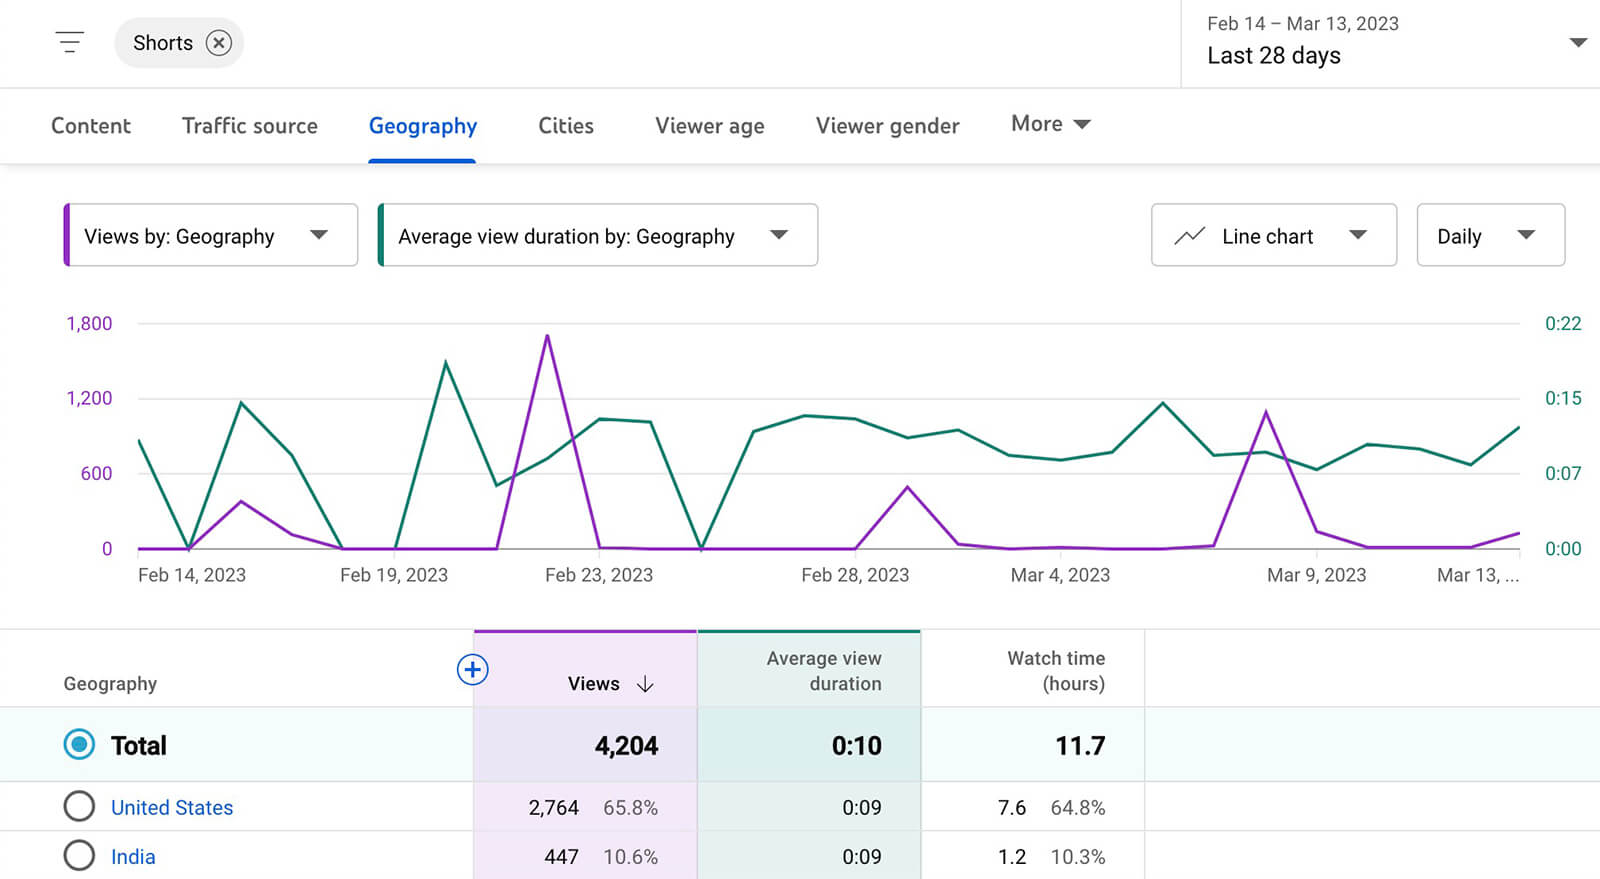
As you fine-tune your YouTube shorts, it’s also helpful to consider the other audience demographics that YouTube Studio offers. For example, you can review audience geographies and subtitle languages to ensure you're creating content that your audience can relate to and understand.
You can click the See More link at the bottom of any audience demographic panel to open advanced analytics. Then you can filter by Shorts and get more nuanced insights into who’s watching your shorts.
Conclusion
As YouTube Shorts becomes an increasingly important factor in growing your YouTube channel and reaching your marketing goals, it’s essential to leverage this format successfully. With YouTube Studio’s new impression, view, and audience analytics, you can identify what type of content appears in the Shorts feed and retains viewers so you can create more short-form content that resonates with your target audience.
Stay Up-to-Date: Get New Marketing Articles Delivered to You!
Don't miss out on upcoming social media marketing insights and strategies! Sign up to receive notifications when we publish new articles on Social Media Examiner. Our expertly crafted content will help you stay ahead of the curve and drive results for your business. Click the link below to sign up now and receive our annual report!

Curious About How to Use AI?
Our newest show, AI Explored, might be just what you're looking for. It's for marketers, creators, and entrepreneurs who want to understand how to use AI in their business.
It's hosted by Michael Stelzner and explores this exciting new frontier in easy-to-understand terms.
Pull up your favorite podcast app and search for AI Explored. Or click the button below for more information.
