 Do you use hashtags in your Instagram posts?
Wondering which hashtags resonate best with your target audience?
Choosing the right tool to analyze Instagram hashtag performance makes it easier to achieve your goals.
In this article, you'll discover five tools to evaluate the performance of your Instagram hashtags.
#1: Command Analytics & Stats for Instagram
Command is an all-in-one Instagram analytics and tracking tool. It's an iOS app only (sorry, Android users). The premium version ($9.99/month) offers hashtag analytics.
In the Post Stats section of the app, you'll discover which hashtags deliver the most engagement for you. You can also view the average number of likes and comments you get using different hashtags.
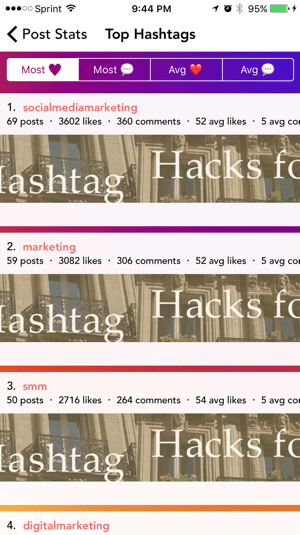
Command will track every hashtag you've used with your Instagram posts. You can see the average number of likes and comments for individual hashtags.
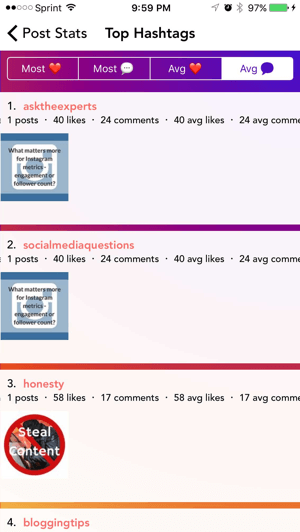
With both tracking options, Command will show you which posts contain individual hashtags. This information helps you analyze how well your hashtags are driving engagement. If your engagement rate starts to rise, it's a sign that your content is striking and/or useful or you're using the same hashtags as your target audience.
#2: Sprout Social
Sprout Social is a well-known social media management tool that offers robust reporting for Instagram. The Instagram report includes a simple but thorough hashtag analysis. It measures the hashtags you use most frequently and the hashtags that garner the most engagement.
This report helps you track your progress as you experiment with new hashtags on Instagram. If you see a hashtag at the top of both lists, you know it's working for you. If it's only in the left column, it's not.
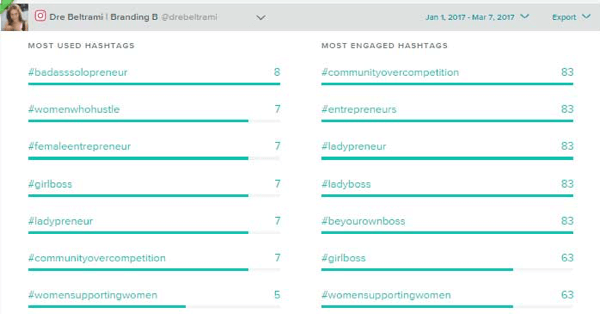
This analysis is helpful if you're building an Instagram community. If a branded hashtag you've created (such as the Rising Tide Society's #CommunityOverCompetition) appears in the right-hand column of the report, you know your efforts are effective. The higher the hashtag climbs on the engaged hashtag list, the more your community is growing.
Tracking your engagement over time is one of the ways you can measure the growth of your Instagram community. Sprout Social packages start at $59.99/month for complete social media management.
#3: Simply Measured
Simply Measured is a comprehensive social tool that focuses on analytics, reporting, and listening. The Instagram hashtag report provides detailed stats on your campaign hashtags. To access the report, go to the Reporting section; it's color-coded brown for Instagram reporting.
Which AI Moves Actually Matter?
That's what every marketer is wrestling with now. New AI strategies, new tools, new takes every week — but no clarity. Most marketers and business owners are trying to figure out AI alone.The AI Business Society is your trusted guide. Get expert-led training you can put to work immediately. Plus a community of marketers sharing what's actually working.
I'M READY FOR REAL AI RESULTSWhile you can run a single report on many hashtags, you may find it more effective to analyze hashtags individually so you can compare them to one another.
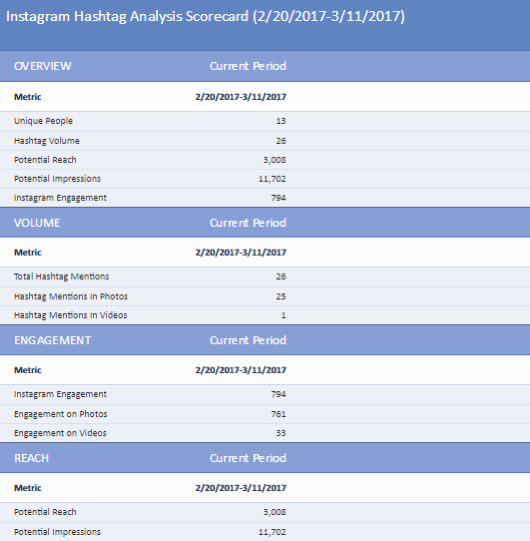
Simply Measured's hashtag report has three sections: Charts, Scorecard, and Appendix. On the Scorecard tab, get a snapshot of results for the hashtag you're measuring. This data is presented in a way that makes it easy to record the metrics for many hashtags so you can compare performance.
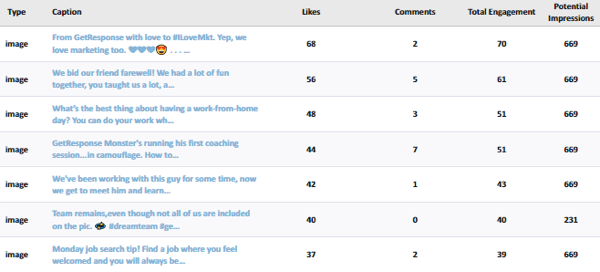
On the Appendix tab, see a list of posts that contain the hashtag for the time period of the report. You can view post-level statistics for each Instagram image or video that contains the hashtag you're analyzing. You'll find links to the posts themselves so you can see the creative and caption for each post.
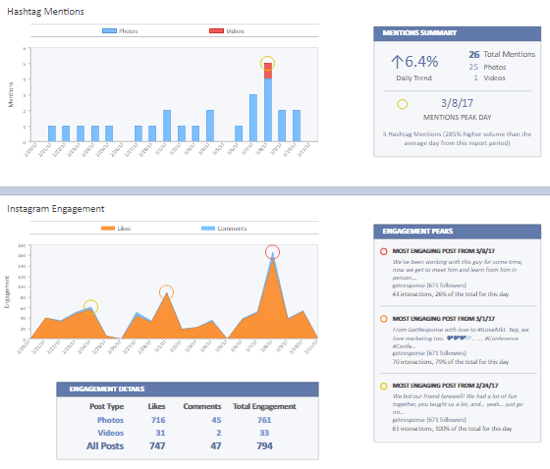
The real beauty of Simply Measured's Hashtag Analysis report is the Charts tab. Get a visual interpretation of deeper insights, including:
- Most engaging moments during the time period you're measuring.
- Most engaged Instagrammers who use your hashtag in their posts.
- Geographic location of the accounts using the hashtag you're analyzing.
Simply Measured even offers a suggestion of “when to post” with the hashtag you're measuring.
Simply Measured's pricing varies by individual company needs.
#4: Iconosquare
Iconosquare is one of the best-known Instagram management systems. It lets you schedule posts, get in-depth analytics, track comments, and respond to comments within the app.
Iconosquare's higher-price tiers (Elite package and higher) include hashtag analysis. The app can measure engagement for hashtags you use in your posts and assess the growth of branded or campaign hashtags.
3 Days of World-Class Training—Zero Travel!

Couldn't make it to Social Media Marketing World and AI Business World this year? Get all of the great content at a fraction of the price with a Virtual ticket.
That’s full access to recordings of every keynote, workshop, and session—the ones people travel thousands of miles to see. Don't wait. Get your Virtual ticket and enjoy actionable content that you can watch anytime, anywhere.
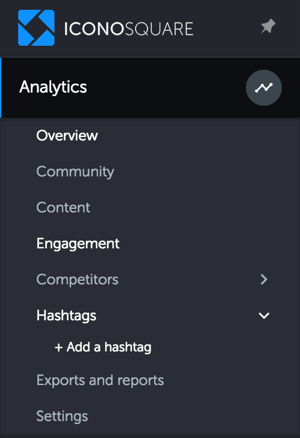
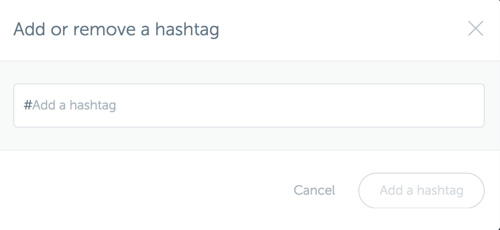
To measure hashtag growth, first add the hashtags to your reporting. In the left-hand navigation, find the Hashtags section under Analytics and click Add a Hashtag.
Then click the plus button under Hashtag and type in your hashtag.
Tracking begins only after you add a hashtag, so the tool can't show you historical data for a hashtag you've just added. Iconosquare is a good option when you track your hashtags from the very beginning of a campaign.
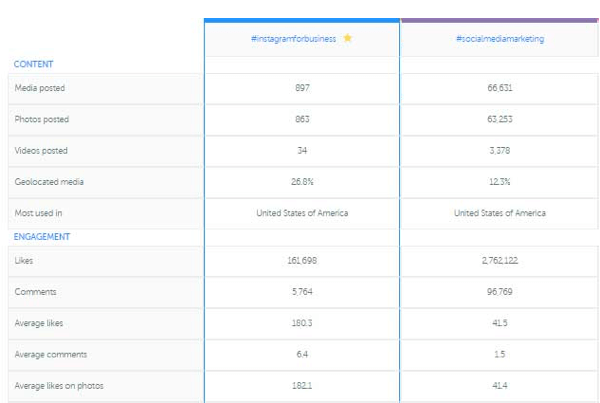
It's easy to compare hashtags on the Overview chart. You can view metrics such as the number of posts with the hashtag and the percentage of geotagged media.
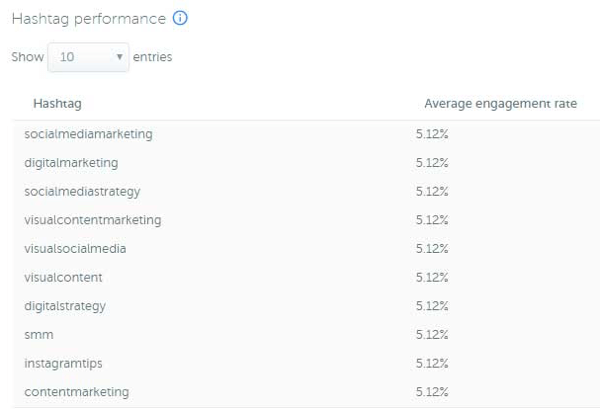
If you want to track engagement levels on your account's hashtags, click the Engagement tab under Analytics. Then scroll down the page to see the engagement metrics for your hashtags.
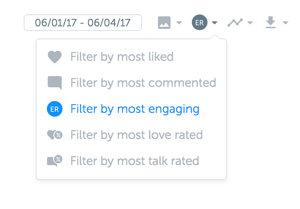
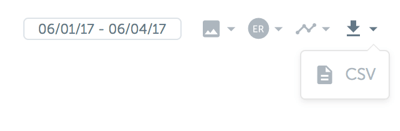
The options in the top-right corner of the report let you customize your layout in the following ways:
- Select the time period for the report.
- Filter results by type of media (Photos/Videos/All).
- Filter results by type of engagement.
- View stats as a chart or table. (I prefer the table because you can sort your table headings.)
You can also download your data as a .CSV file.
Iconosquare is reasonably priced considering it includes both account-level hashtag data and branded/campaign hashtag tracking. Packages that include branded/campaign hashtags start at $29/month.
#5: Keyhole
Keyhole is a social media analytics tool for agencies, marketers, journalists, and executives. It specializes in tracking keywords and hashtags on Twitter and Instagram. Like Iconosquare, it will track hashtag usage statistics at the account level and real-time branded/campaign usage.
Branded/Campaign Hashtag Data
To access your branded/campaign hashtag information, start at the top menu and click Hashtag & Keyword Tracking. Then select the hashtags/keywords you want to measure.
The real-time hashtag tracker measures the following stats for individual hashtags:
- Number of posts
- Number of users
- Reach
- Impressions
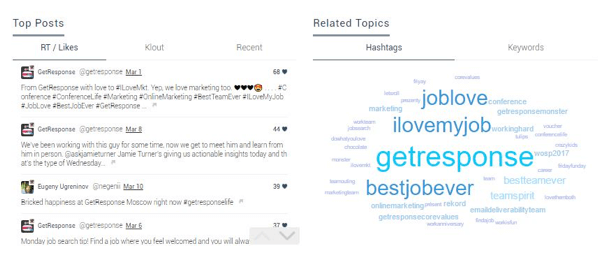
What sets Keyhole apart from other hashtag tracking tools is how it displays secondary information. You can see top posts using the hashtag and view related hashtags/topics as a tag cloud, giving you a visual representation of how hashtags connect on the web. You can also see the Klout score of the poster or a list of recent media posted with the hashtag.
Account-level Hashtag Data
Keyhole offers account-level analytics for Instagram as well. To access your account analytics, go to the top of the screen and choose the Account Tracking option (at the right-hand side of the screen). Then scroll down to the account you want to analyze.
To find your hashtag analysis, choose Optimization from the left-hand navigation. This section of the reporting platform offers suggestions for improving your post strategy, such as the ideal posting time, and post length and hashtags for best engagement. You can see your top five hashtags by either engagement or frequency.
A feature unique to Keyhole is the optimal number of hashtags to use for top engagement.
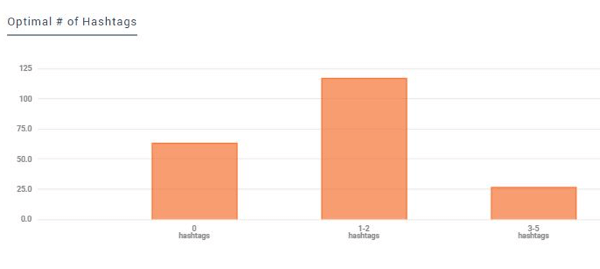
Note that this graph tracks only hashtags in your Instagram captions. If you place your hashtags in the first comment on your posts (as many do), this tool won't measure those hashtags. Click on the individual bars to see the actual posts included in the measurement.
Keyhole's pricing starts at $132/month, billed annually.
Want more like this? Explore Instagram for Business!
In Conclusion
While hashtags don't replace good creative, they're an essential part of your overall Instagram strategy. Knowing how to use them effectively is every social media marketer's job, so you need to be measuring hashtag performance.
What do you think? Do you have any tools for assessing Instagram hashtag performance to add to this list? Share your thoughts in the comments below.

Curious About How to Use AI?
Our newest show, AI Explored, might be just what you're looking for. It's for marketers, creators, and entrepreneurs who want to understand how to use AI in their business.
It's hosted by Michael Stelzner and explores this exciting new frontier in easy-to-understand terms.
Pull up your favorite podcast app and search for AI Explored. Or click the button below for more information.
