 Are you considering infographics for your marketing?
Can you effectively communicate visually?
Infographics are powerful ways to get attention.
In this article, you'll discover how to craft infographics that are widely shared.
Why Infographics?
Modern humans have been around for about 200,000 years and for almost all of that time (97%, to be precise), we've survived by reading just the visual imagery around us.
We didn't start using alphabets until about 5500 years ago.
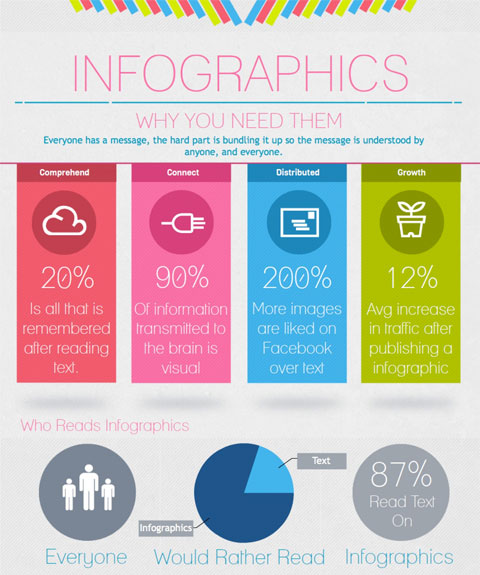
The fact is, our evolving brains continue to interpret images faster than text. What that means for brands is visual storytelling is essential to delivering highly effective messages.
Because of that, infographics, a hybrid of images and text, have become a great fit for social media marketing. They combine charts, diagrams, pictures and stylized text into a visually pleasing package.
Examples of companies using infographics include Pepsi, Kraft, Pritikin, Coupon Chief, Marvel, and Venere.com.
Infographics get noticed, invite engagement, are highly flexible and are popular on social networks. They also tend to function as linkbait for industry blogs, something that is appreciated by our SEO colleagues.
If you want that attention on your marketing message, you'll have to do more than share a picture surrounded by text. Here are seven steps to creating your first infographic.
#1: Plan Your Story Around Your Objectives
As a social media marketer, when you create an infographic, you aren't just making a picture out of random data and a pretty font. You're crafting a tool you can use to achieve a particular objective, and that takes planning.
Picking a topic for your infographic is the easy part; you probably already know what subject you want to tackle. What you may not have fleshed out are your objectives, or the why of your topic.
Get World-Class Marketing Training — All Year Long!
Are you facing doubt, uncertainty, or overwhelm? The Social Media Marketing Society can help.
Each month, you’ll receive training from trusted marketing experts, covering everything from AI to organic social marketing. When you join, you’ll also get immediate access to:
- A library of 100+ marketing trainings
- A community of like-minded marketers
- Monthly online community meetups
- Relevant news and trends updates
What are you trying to do with your infographic? Do you want to establish yourself as an information source? Bring new customers to your website? Capture email addresses? Get more followers on social networks? Earn mentions in blogs? Boost your search rankings?
All of those objectives are tempting, but stay focused! Prioritize your objectives and don't include anything that doesn't help you reach the most important ones.

Next, craft a story around your topic that engages viewers and helps you meet your objectives. Remember, the data you share is only as interesting as your story.
As your story takes shape, write introductory copy that gives context to your image, story and objectives. This copy helps you stay true to your plan and objectives. It also plays an important role when you share the infographic or publish it on a different site.
Let's suppose you're working for a health care company and you want to plan an infographic on the topic of common everyday injuries. Your story could be about how frequently these injuries occur and how expensive they can be to treat, with the objective of getting people to review your company's coverage and share the infographic with their social networks.
Knowing your objectives will help you craft a stronger infographic.
#2: Gather Your Data
Infographics originated as data visualization tools. Numbers are still the foundation of most of them. Numbers serve to validate your points and persuade your viewers. (But it's not unheard of to find excellent qualitative infographics.)
If you know the topic you want to tackle, but you don't have your data yet, there are a few places you can start your search.
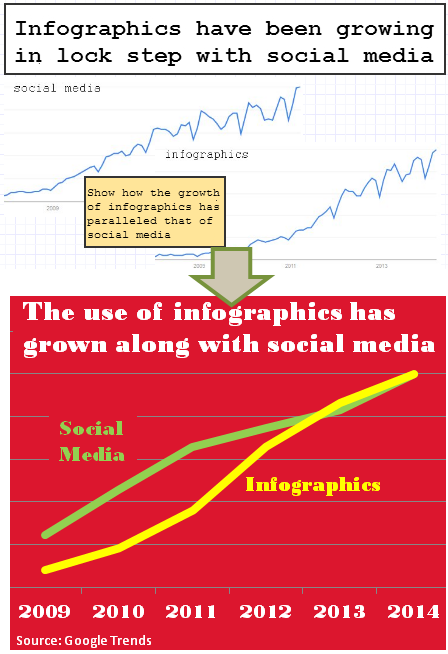
Google offers Public Data, and Google Trends is a good way to gauge public interest for any search term.
Don't forget your local census department. In the United States, Census.gov has mountains of data you can sift through.
Need help finding friendly numbers? In addition to your favorite industry sources, you can try Many Eyes, an IBM project that allows you to search and visualize publicly available data sets.
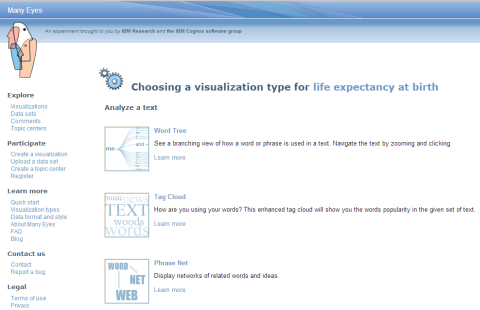
You'll want to share data of value to your audience.
#3: Sketch Your Idea
It may be tempting at this point to start picking out great colors and charts, but effective infographics always start with good, old-fashioned, back-of-the-envelope planning.
For many people, pen and paper are still the tools of choice for sketching or wireframing, but you could also use Google Slides, Gliffy and Creatly. Both Gliffy and Creatly have free trial versions, and Creatly also has a library of the “people silhouettes” that have become a staple in many infographics.
As you begin wireframing, think about the first item or element you want viewers to see and how many more items it will take to tell your story. Create a hierarchy of elements that leads your reader through your infographic narrative, making your strongest argument first of course.
As you refine your wireframe, make your story as succinct and interesting as possible. “The best infographics are ones where you grasp the essence in 10 seconds, and could spend 30 minutes being delighted by the cleverness of the detail,” advises Avinash Kaushik, author of the book Web Analytics 2.0 and the data analysis/presentation blog Occam’s Razor.
And don't forget the all-important branding for the bottom of your infographic. In some cases, that branding may be the only way for viewers to find their way back to you. Include a call to action such as “To learn more about [TOPIC], visit xyz.com.”
#4: Find Your Inspiration
Whether you have an infographic design in mind or not, it's a good idea to look at what's already out there (even if it's just to ensure your idea is different enough to capture attention).
Pinterest is always a great source for design inspiration, but also look at Daily Infographic and Visual.ly.
At Daily Infographic, you can find data-filled illustrations and get a feel for what appeals not only to you, but also to others. If you see several images that have been shared a lot, take note of any common design elements.

Discover Proven Marketing Strategies and Tips
Want to go even deeper with your marketing? Check out the Social Media Marketing Podcast! Publishing weekly since 2012, the Social Media Marketing Podcast helps you navigate the constantly changing marketing jungle, with expert interviews from marketing pros.
But don’t let the name fool you. This show is about a lot more than just social media marketing. With over 600 episodes and millions of downloads each year, this show has been a trusted source for marketers for well over a decade.
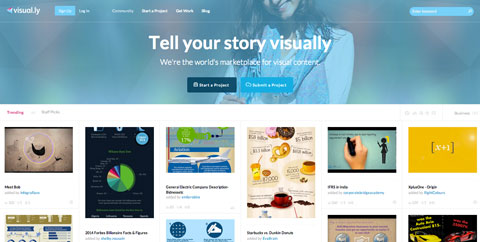
Visual.ly maintains a great free library of eye-catching infographics and may act as a springboard for your own ideas. You can also use Visual.ly to create your infographic (for a fee) when you're ready.
Wherever you look for inspiration, remember it's good to mix things up. Include text quotes and short facts to add interest between charts or images.
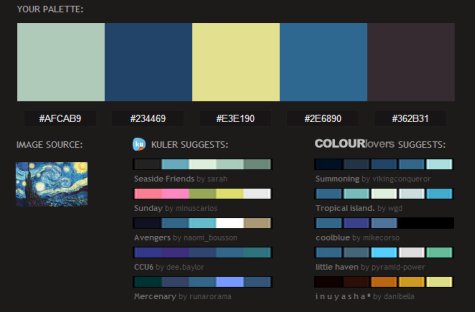
If you'd like help selecting colors that complement a specific image, take a look at Pictaculous, a free tool that suggests color palettes.
I advise avoiding a white background for your infographic if at all possible. The white may work fine on your site, but when other sites republish your image it may not stand out without some color holding it together.
#5: Build Your Infographic
If you have access to professional design talent, this would be a great time to buy them lunch. If it's just you, then buy yourself lunch and take a look at the tools below.
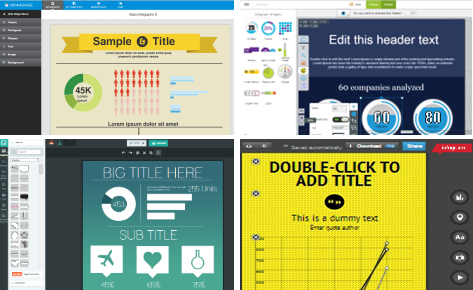
Even if you have no idea how to start, there are powerful cloud-based browser apps that let you create infographics using drag and drop.
Venngage, Easy WebContent Presenter, Infogr.am and Piktochart all offer customizable templates, image galleries and tools for creating charts.
These apps typically allow you to design your infographic for free, but downloading the image may incur a small fee.
Venngage and Infogr.am, for example, ask you to upgrade for approximately $20 a month. Piktochart appends their branding in free mode, while Easy WebContent Presenter is currently in beta and truly free right now.
I suggest using the tools in free mode to design a quick, simple infographic, then continuing the process through to the download option. At that point you can determine the costs and benefits of upgrading. In most cases, $20 for a month of infographics is a good investment.
You may find that the design tool you chose presents you with an obstacle; for example, the inability to create the one perfect chart that you need. If that's the case, you can create the chart outside of the design app (e.g., in PowerPoint) and then carefully paste it into your infographic as an external image.
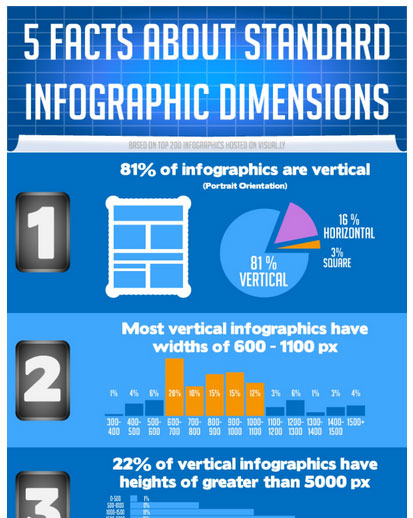
Need some advice picking dimensions that make it easier to get shared and republished? No problem! Visual.ly has an infographic for that (of course).
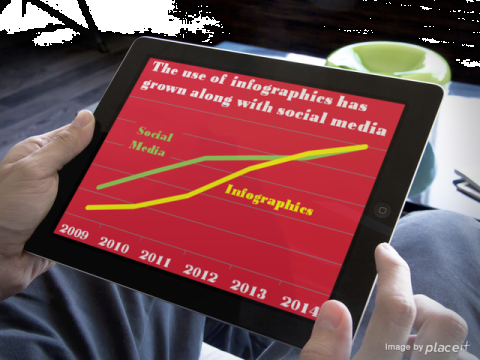
You'll want to be sure your infographic is flawless on mobile devices as well. PlaceIt resizes and reorients an image to make it appear as a screenshot on a smartphone, tablet or desktop.
Even when you're satisfied with your infographic, you're not quite done! Viewers and search engines are happier when images load quickly, and infographics can take up a lot of disk space.
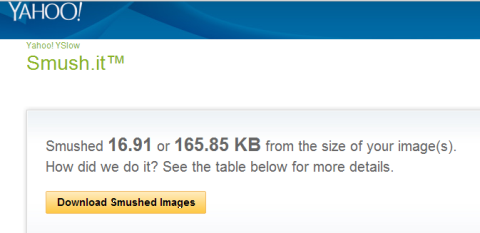
A good designer will have tips for making a fast-loading image, but you can also try Smush.it. This aptly named free app from Yahoo! searches for useless bytes and creates a lighter version of your infographic without any loss of quality.
#6: Create Your Infographic's Social Preview
Your finished infographic looks great and you're ready to publish and share it on all of your favorite social networks. But wait!
Are you sure the image looks good in a news feed? When people share images on sites like Facebook or Twitter, those platforms don't always display the image properly.
The Twitter desktop news feed, for example, resizes an infographic to approximately 500 pixels wide and then attempts to discern the most interesting 250 pixels of height to display. You will very likely disagree with its selection.
To avoid this problem, choose the most engaging section of your infographic and create a new, smaller image that is 250 pixels high and 500 pixels wide.
Share this smaller image across all of your social channels along with a link back to your site where the full infographic is displayed (including all of its text, additional share buttons and other calls to action).
Not only does sharing the smaller image solve the issue of random cropping, but it encourages more click-throughs to your website.
Of course, all networks and third-party apps have different dimensions they crop to, but Twitter's 250 x 500 compromise should work well in most instances.
#7: Share Your Infographic
As you look for ways to share your infographic, consider reaching out to bloggers who regularly write about your topic. Blogger partnerships can be good opportunities for both of you.
From the blogger's perspective, your infographic is an opportunity to deliver relevant, visually appealing content without spending a lot of time crafting an article from scratch.
You, of course, would like your infographic to be seen by as many people as possible (with appropriate links back).
The standard rules of blogger outreach apply: be polite, do your homework and make their decision as easy as possible. Popular bloggers get a lot of pitches, so make it obvious that your request is more than a form letter.
“Cookie-cutter pitches won't work. Show the blogger the respect of some research and a personalized message,” advises social media blogger Heidi Cohen. “Put yourself in their position—how is publishing your infographic going to help them?”
“If you do your blogger outreach correctly, you can get links from some really high-authority domains,” adds Ian Cleary of Razor Social. “The text that accompanies the infographic is important because it adds value and can help the search engines. For the bigger sites, I offer to do a guest post so I can control the article.”
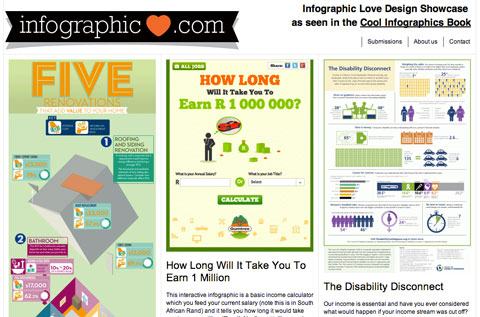
Finally, to keep your infographic active for as long as possible, submit it to searchable directories like Visual.ly, Infographic love, Infographics Archive and Pinterest, of course.
Conclusion
Your audience's news feeds are a barrage of information, much of it text. Family and friend updates, news and marketing messages compete for attention. An infographic makes your message stand out.
Our brains are wired to process imagery more quickly than text. Take advantage of that and create infographics that tell a provocative story your readers can't resist.
What do you think? Have you used infographics in your marketing? Have you come across any other good tools to help create effective infographics? Please share with us in the comments!
Attention Agency Owners, Brand Marketers, and Consultants

Introducing the Marketing Agency Show–our newest podcast designed to explore the struggles of agency marketers.
Join show host and agency owner, Brooke Sellas, as she interviews agency marketers and digs deep into their biggest challenges. Explore topics like navigating rough economic times, leveraging AI, service diversification, client acquisition, and much more.
Just pull up your favorite podcast app, search for Marketing Agency Show and start listening. Or click the button below for more information.
