 Do you want to measure the impact of your social media marketing efforts?
Wondering which social media metrics you should focus on?
Analyzing the raw data on campaign performance helps you determine which tactics are working.
In this article, you'll discover the top 10 social media metrics you should be monitoring on Facebook and Twitter.
#1: Track Follower Growth
Your total count of fans, followers, and page likes represents the number of unique people who have taken an interest in your business. Ideally, you should consistently grow your following. This means the content you're sharing and the ways you're engaging your audience need to be enticing enough to attract new fans.
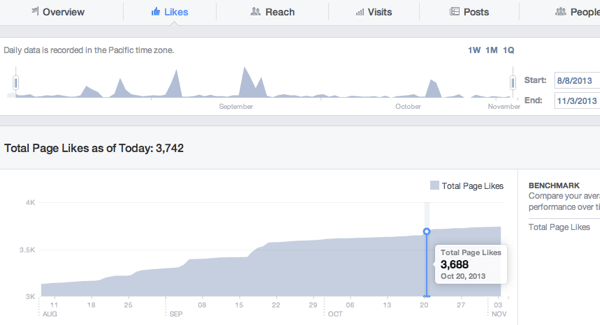
On Facebook, it's easy to get a detailed analysis of your number of page likes. Go to your page and click the Insights tab. Then click Likes in the left navigation.
You'll see your total likes, as well as gains and losses of likes over a designated time period. This lets you monitor your audience's reactions to certain posts or determine which time periods are best for bringing in new fans.
On Twitter, you can find your follower count on your Twitter account page.
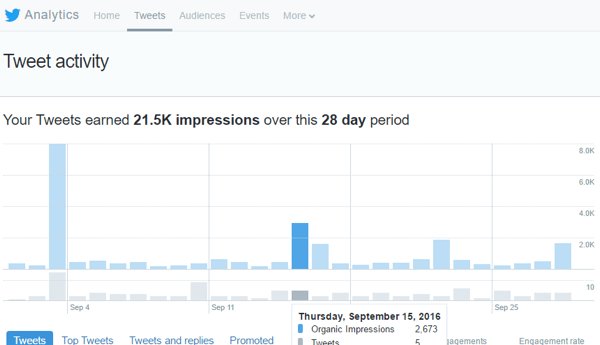
To view trends and statistics for your followers, visit Twitter Analytics. Click on your profile picture at the top right of any Twitter page and choose Analytics from the drop-down menu.
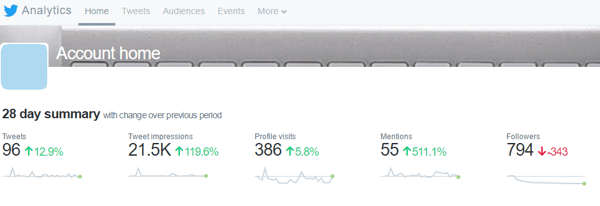
The data at the top of the page shows a continuous 28-day summary, with information on your followers on the far right. You can see gain/loss trends for recent followers. Scroll down to see a summary for previous months, which includes changes in followers.
#2: Identify Optimal Times for Engagement
Knowing when your audience is most likely to engage with your content is important. It helps you tailor your strategy so you post your content at the right time (when your audience is most active) and the best days of the week.
Get World-Class Marketing Training — All Year Long!
Are you facing doubt, uncertainty, or overwhelm? The Social Media Marketing Society can help.
Each month, you’ll receive training from trusted marketing experts, covering everything from AI to organic social marketing. When you join, you’ll also get immediate access to:
- A library of 100+ marketing trainings
- A community of like-minded marketers
- Monthly online community meetups
- Relevant news and trends updates
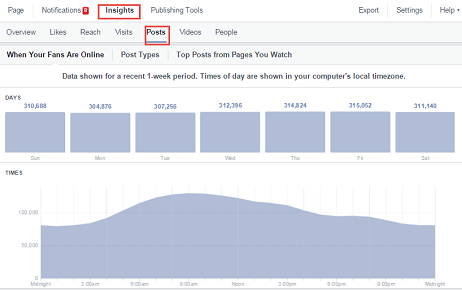
On Facebook, you can view your followers' daily activity over the last week. By narrowing it down to individual days, you can see how engagement shifts by the hour.
On your Insights page, click Posts in the left navigation and make sure When Your Fans Are Online is selected at the top. Then hover over the different days of the week (Sunday through Saturday) at the top of the Posts tab.
Twitter data is a little less comprehensive, as it doesn't provide engagement statistics for specific times throughout the day. However, you can still see how engagement rises and falls by day over the last 28 days (default) or another designated time period.
To find this information in your analytics, click the Tweets tab at the top of the page.
#3: Track Likes and Reactions for Your Posts
Gauging how your audience reacts to the content you post and share is crucial for any marketing strategy. This direct response metric helps you determine whether your audience is interested in what you're currently publishing, and should inform the type of content you share in the future.
If your only engagement is chirping crickets on certain topics, cut that content from your editorial calendar or send those articles through another channel to a different audience segment that might be more receptive.
Facebook provides more in-depth measurements with its updated reaction system, which lets you know whether your fans like, love, dislike, or are upset by something you shared.
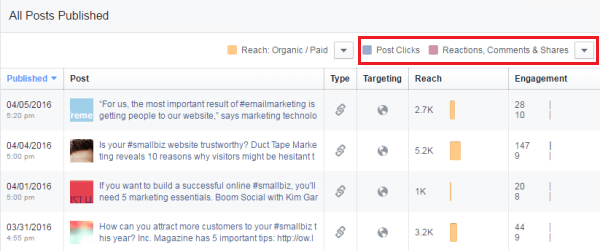
To find this information, go to your Insights page and click the Posts option in the left navigation. Then scroll down to All Posts Published and click on the right drop-down arrow to view Reactions, Comments, and Shares.
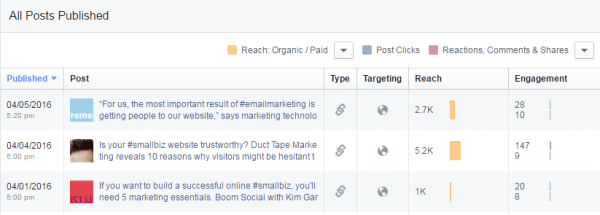
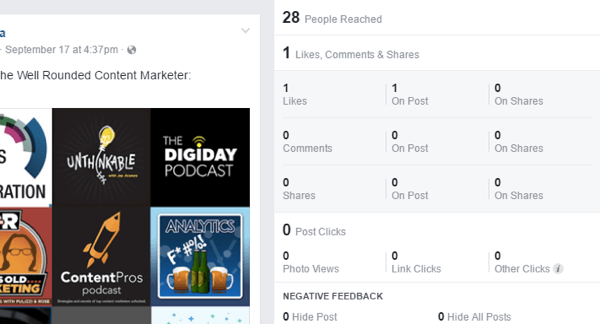
The data in the Engagement column measures the total reactions for a post. If you want to see a more detailed look at a post's performance, click on the post link to view the breakdown of reactions from your audience.
Twitter has a similar approach and displays all of your tweets for a selected timeframe. To find this data in your analytics, click the Tweets tab at the top and scroll down to view your tweets. You can also click Top Tweets to view only your most popular tweets.
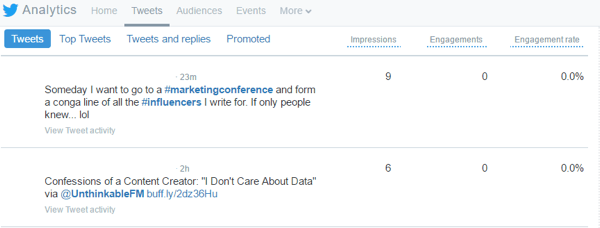
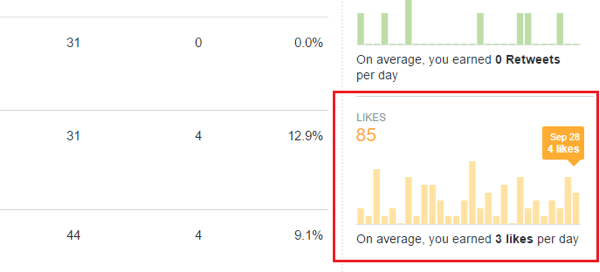
The Engagements column on the right is helpful, but it includes a lot of extra information (basically any interaction with the tweet). If you're just looking for likes for a particular post, scroll through the graphs on the right until you see Likes. This data shows the daily number of likes that your tweets are receiving, as well as your average likes per day.
#4: Monitor Mentions
Your fans and prospects are out there talking about you and you want to be a part of that conversation. For this reason, it's important to track your mentions. On Facebook, you'll get notifications whenever someone tags your business/username in their post.
If people are not directly tagging you, you'll need to use a third-party tool to keep track of mentions on Twitter.
#5: Delve Into Audience Demographics
As you grow your following, monitoring your audience demographics can inform your strategy and help you modify posts and paid ads for future promotions.
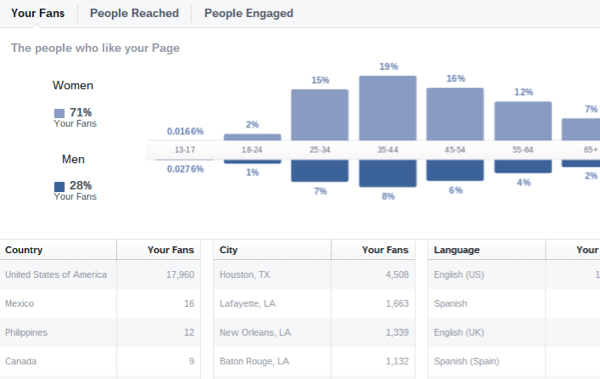
On Facebook, you can access audience information in your Insights under People. Click the Your Fans section to view various demographic factors for your fan base.

Discover Proven Marketing Strategies and Tips
Want to go even deeper with your marketing? Check out the Social Media Marketing Podcast! Publishing weekly since 2012, the Social Media Marketing Podcast helps you navigate the constantly changing marketing jungle, with expert interviews from marketing pros.
But don’t let the name fool you. This show is about a lot more than just social media marketing. With over 600 episodes and millions of downloads each year, this show has been a trusted source for marketers for well over a decade.
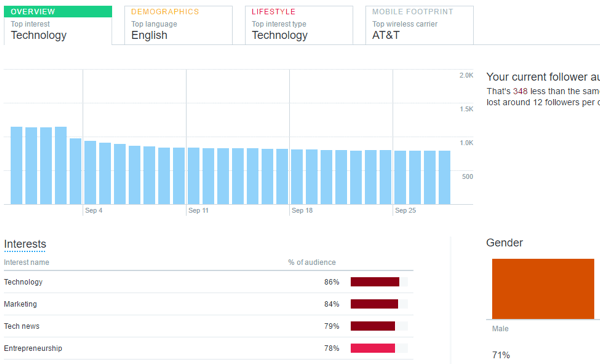
On Twitter, your analytics data provides audience information related to your followers. Simply click on Audiences to find the relevant information.
You'll see a broad overview of your audience, as well as specific demographics, lifestyle interests, and other information.
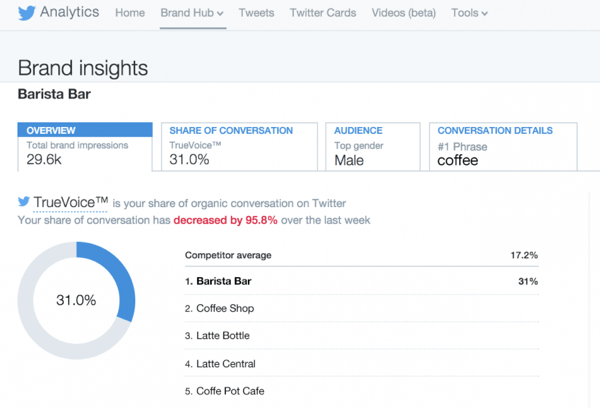
If you're using Twitter for Business with paid advertising, you'll also have a Brand Hub tab at the top of the page, which includes more in-depth audience demographic information.
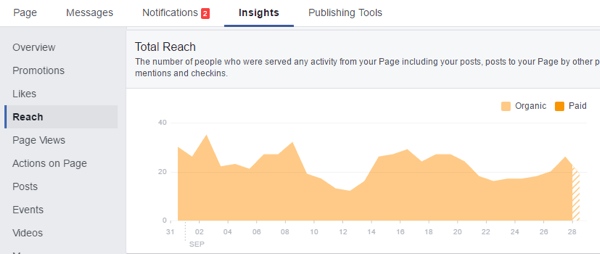
#6: Determine Reach
The Reach metric combines the number of people you've reached both within and outside of your audience. When people engage with your content, their activity is usually shared with their connections, which increases your page's reach.
Mixing more engaging content into your social strategy can significantly improve the reach of both your posts and your business.
On Facebook, go to your Insights tab and click the Reach option in the navigation panel on the left. The top graph you see displays your post reach, which is basically the number of people who saw your post.
Scroll to the bottom of the page to find your total reach. This is the number of people who saw any activity from your page as a result of follower interactions, ads, mentions, check-ins, and so on.
In the top Post Reach graphic, you can click on any given day to view posts that contributed to that day's post reach count.
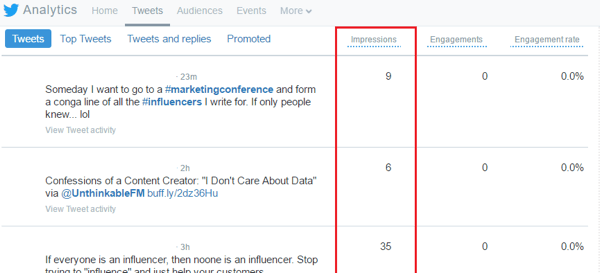
On Twitter, click the Tweets tab in your analytics to display an Impressions column. This is the number of impressions for each tweet. As people interact with your tweets, the number of impressions will rise as a result of expanded reach.
#7: Review Replies and Comments for Your Posts
Replies and comments on your posts can help you gauge how interesting or engaging your topics are. As with reactions, they're direct response metrics that help you weed out uninteresting content from your publishing schedule.
Because replies are typed out, you can also view individual posts that performed well to measure follower/fan sentiment.
To find this information on Facebook, go to your Insights and click the Posts option in the left navigation. Scroll down to All Posts Published and click the right drop-down arrow to view Reactions, Comments, and Shares.
From here, you can view comment counts. If you want more details on the comments and audience sentiment, click on the post link to open the post's details and read through your followers' comments.
On Twitter, you can easily measure the number of replies for each post, but bringing up replies to your tweets is a little more complicated.
You can view post reply counts in your Twitter analytics. Click the Tweets tab at the top of the page and choose either Tweets or Top Tweets below the graph.
Click on individual tweets to view engagement levels, which include the number of replies you received.
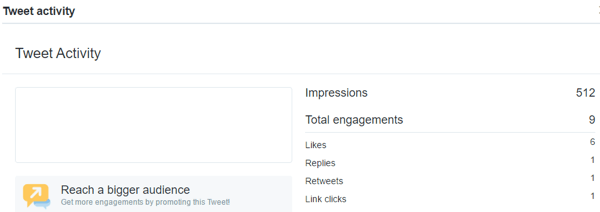
The graph on the right shows both the total replies for a designated period and the average number of replies for each day.
#8: Find Out What Content Is Being Shared
Content shares are important because they reflect how your audience perceives the value of your content. Highly shared posts indicate that your audience found the topic or type of content particularly helpful, or had a strong emotional or psychological connection to it. The more often content is shared, the greater the reach.
To measure shares on both Facebook and Twitter, follow the above steps for measuring replies and comments. For Facebook, find your shares, and for Twitter focus on retweets.
#9: Track Referral Traffic From Social Media
Acquisition data tells you what kind of traffic you're getting from social to your website and how that traffic performs once it arrives. If you find one or more social channels aren't bringing you the number of click-throughs you expected, use this data to improve your calls to action and campaigns.
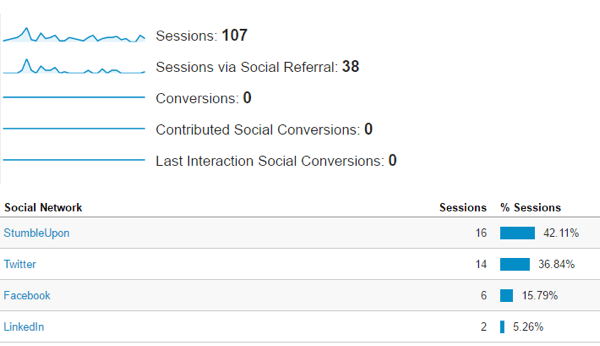
Unlike the other metrics listed above, you'll find your referral traffic data in your Google Analytics. Under Acquisition in the left navigation, click on the Social top-level menu. In the menu under Social, click Overview or Network Referrals.
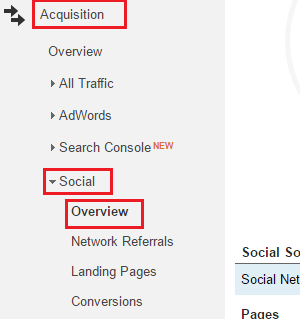
The Overview tab provides basic information on total sessions from each social network. On the the Network Referrals tab, view session counts, page views, duration, and pages visited per session.
#10: Examine Click Rates
Click rates have everything to do with conversions. Although they don't specifically focus on revenue generation, clicks help you understand how your followers engage with you, why they're engaging, and what's making them click on different links.
Facebook has a fairly extensive click-tracking system. If you go to Posts on the Insights tab, you'll find the number of post clicks for each individual post. This data signifies what content your fans found most interesting or enticing.
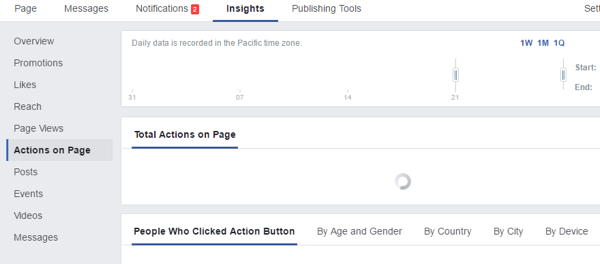
Go to Actions on Page in the left navigation to see click counts for various elements (phone, directions, website, call to action, etc.). It also shows clicks based on user demographics.
Use the above method for tracking retweets on Twitter to view individual link clicks in posts.
You can also use a service like Buffer or Bit.ly for tracking your link clicks with custom links for different social channels.
Conclusion
Monitoring your brand's online performance is important, but keeping a close eye on your audience metrics is even more crucial. It's the best way to create targeted, customized content to improve engagement with your audience.
What do you think? How often do you monitor follower metrics at this level? Does data analysis influence your marketing strategy? Let us know your cool tips and tactics in the comments below.
Attention Agency Owners, Brand Marketers, and Consultants

Introducing the Marketing Agency Show–our newest podcast designed to explore the struggles of agency marketers.
Join show host and agency owner, Brooke Sellas, as she interviews agency marketers and digs deep into their biggest challenges. Explore topics like navigating rough economic times, leveraging AI, service diversification, client acquisition, and much more.
Just pull up your favorite podcast app, search for Marketing Agency Show and start listening. Or click the button below for more information.
