Are you using TikTok? Wondering how to measure the results of your TikTok marketing efforts?
In this article, you'll learn more about TikTok analytics.
#1: Switch to a TikTok Pro Account to Access TikTok Analytics
TikTok recently launched a native analytics tool for Pro accounts, which are similar to Instagram Creator accounts. TikTok's analytics dashboard reveals insights about your overall audience and the performance of published content.
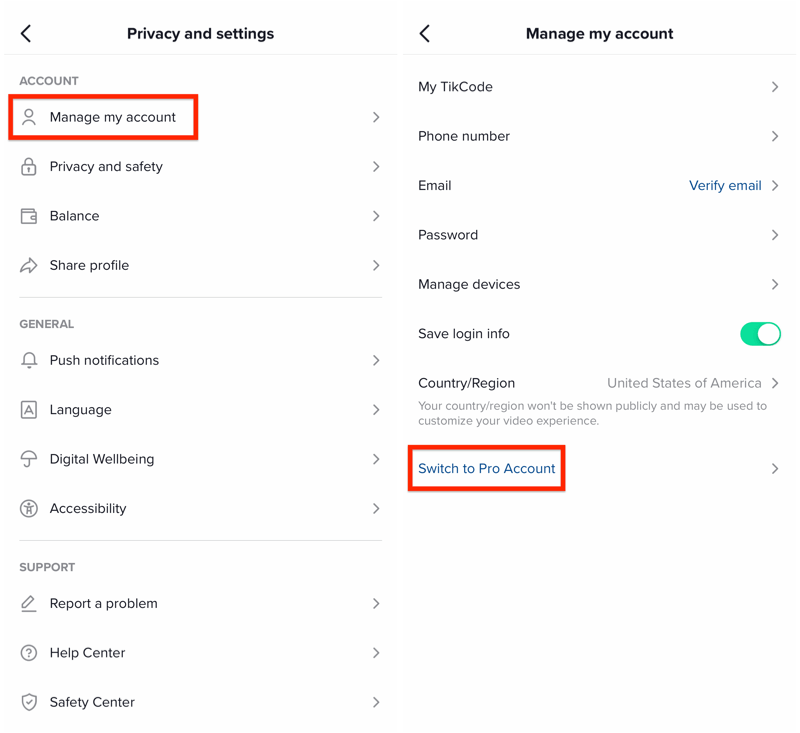
Switching to a Pro account is easy. Start by going to your profile settings and tapping the Manage My Account option. On the next screen, tap Switch to Pro Account.
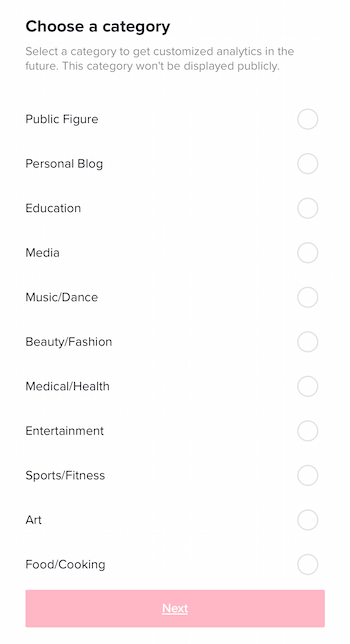
Next, you're prompted to select a featured category for your account. The categories include Public Figure, Personal Blog, Education, Media, Entertainment, and more.
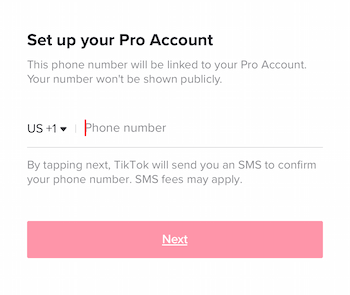
The last step is to enter a phone number for your account and then enter the code you receive via SMS.
Once you've set up your Pro account, navigate back to the Settings menu and you'll now see an Analytics option. Tap this option to open your TikTok analytics dashboard.
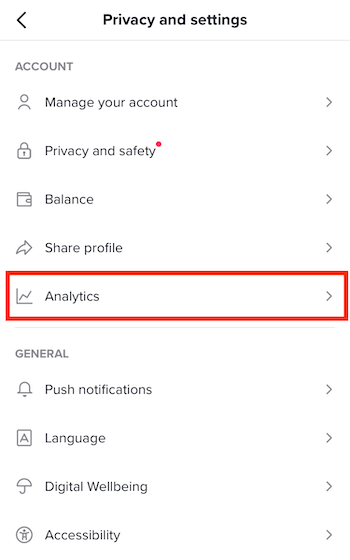
TikTok analytics will start recording data after you switch to a Pro account; the dashboard won't display any historic data. You'll need to wait up to 7 days for your account to generate enough data to start displaying insights. During this period, I recommend publishing as much TikTok content as possible so you can get deeper insights.
Once the analytics data starts populating, you can dive into your account insights. As with all analytics, this data will become more accurate over time as you publish more content.
There are three main categories that TikTok displays within your account dashboard:
Which AI Moves Actually Matter?
That's what every marketer is wrestling with now. New AI strategies, new tools, new takes every week — but no clarity. Most marketers and business owners are trying to figure out AI alone.The AI Business Society is your trusted guide. Get expert-led training you can put to work immediately. Plus a community of marketers sharing what's actually working.
I'M READY FOR REAL AI RESULTS- Profile overview
- Content insights
- Follower insights
Tap the tabs at the top of the Analytics screen to dive deeper into each category and uncover new insights.
#2: TikTok Analytics Profile Overview
The profile Overview tab is useful for identifying how well your TikTok profile is performing overall. This data includes your total video views, profile views, and follower count.
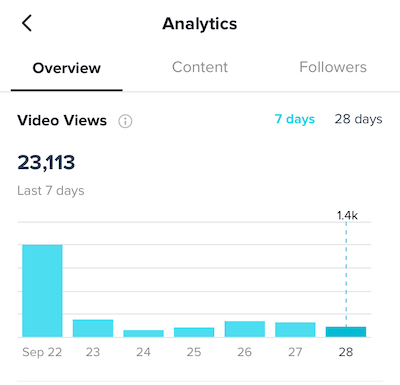
Video Views
The top of the Overview tab shows total Video Views, which is the total number of times your TikTok videos have been viewed in the past 7 or 28 days. This data is broken down by day.
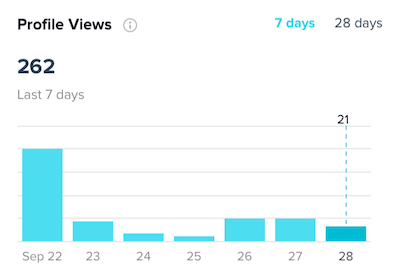
Profile Views
The Profile Views metric is how many times your TikTok profile was viewed over the past 7 or 28 days. Because this information is separated out by day, you can see what content is driving users to visit your profile.
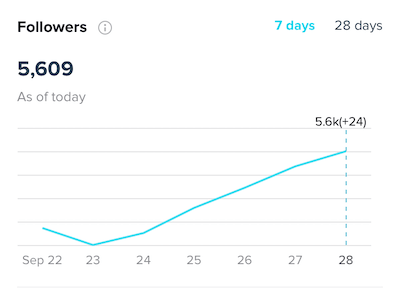
Follower Count
The Followers graph shows your total follower count over a 7- or 28-day period.
Follower insights allow you to associate any popular TikTok videos with overall account followers. By looking at the days you publish content and aligning that content to follower growth, you can gauge whether your content was engaging enough to drive users to follow your brand.
Pro Tip: You can use the profile Overview data to interpret a funnel of users, starting with people who begin consuming your content through to those who become engaged followers.
This allows you to estimate your conversion rate from your total video views through to users who visit your profile, and then the conversion rate of those who actually followed your profile.
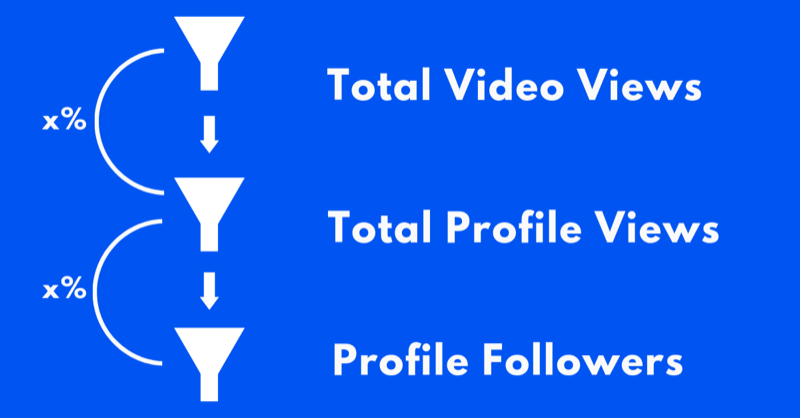
This analysis will help you prepare an effective content strategy. When you have a clear understanding of your content conversion rate, you can start planning a posting schedule and more accurately determine your account growth rate.
So while the data presented on the Overview tab isn't the most advanced analysis, you can use it in strategic ways.
#3: TikTok Analytics Followers Data
The Followers tab in TikTok analytics shows a top-line view of your audience demographics. You can see a gender split and a percentage breakdown of your audience by location.
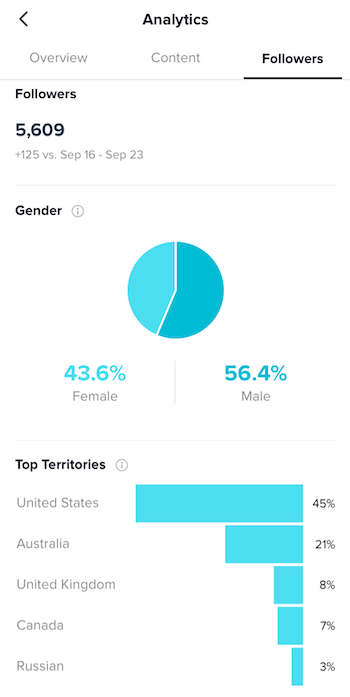
Because TikTok has scaled across multiple countries, you can expect to see a diverse breakdown of territories.
#4: TikTok Analytics Content Data
The Content tab in TikTok analytics offers the richest insights. In a top-level view, you can see the total views of each video post from the past 7 days, displayed in order from newest to oldest.
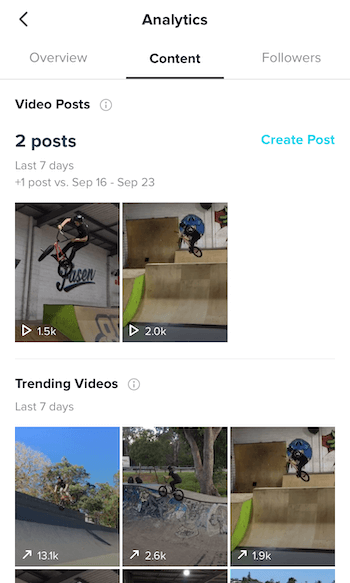
It also reveals which of your videos have been trending on the For You page within this period, as well as the total number of views those videos have accrued throughout the process.
My favorite feature of the Content analytics is the ability to dive into each post and uncover richer insights. To view the analytics for an individual post, simply tap on the post thumbnail to open its unique dashboard. The analytics for each post show:
- Total like count of post
- Total number of comments
- Total shares
- Total play time of the video
- Total video views
- Average watch time
- Traffic source types
- Audience territories
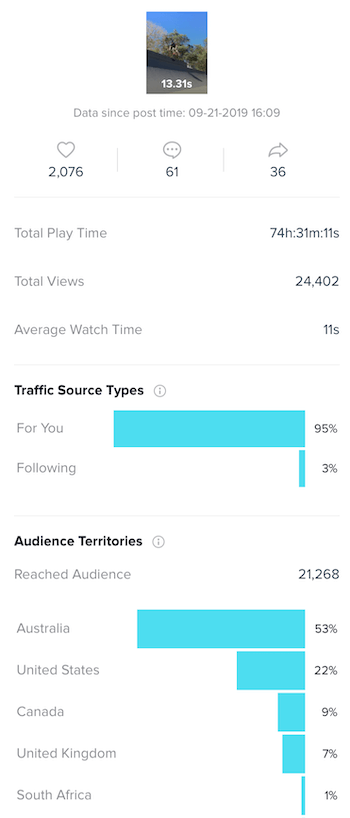
The Audience Territories data helps you identify whether a particular piece of content resonates with different audience demographics.
By reviewing the territory engagement for individual posts, you can compare this data to your overall audience territories revealed on the Followers tab. Then see if different forms of content resonate with new audiences from different locations. If you notice particular posts perform better in certain locations, you can double down on creating similar content.
3 Days of World-Class Training—Zero Travel!

Couldn't make it to Social Media Marketing World and AI Business World this year? Get all of the great content at a fraction of the price with a Virtual ticket.
That’s full access to recordings of every keynote, workshop, and session—the ones people travel thousands of miles to see. Don't wait. Get your Virtual ticket and enjoy actionable content that you can watch anytime, anywhere.
#5: Analyze Other TikTok Accounts With Pentos
Although TikTok's native analytics tool is useful for gathering data for your own profile, it doesn't give you insights about the performance of profiles you don't own. If you want to reveal insights about your competitors, or influencers you may want to partner with, TikTok is unable to share any useful data.
With no public TikTok API, existing influencer platforms currently lack the ability to display valuable data about public accounts. I was determined to uncover a solution for sourcing TikTok influencers, and I recently found a platform called Pentos, which leverages publicly available profile data to display insights on TikTok accounts.
As of this writing, Pentos is the only analytics solution I've found that measures data from third-party TikTok accounts. It allows you to analyze the performance of other accounts, as well as get insights on trending hashtag challenges.
Signing up for a free Pentos account lets you track up to three accounts. For additional functionality and hashtag analytics, you'll need to upgrade to one of the paid tiers, which start at around $20/month.
Unlike TikTok's native analytics tool, Pentos will begin displaying historic profile data immediately when you start tracking an account.
To begin using this tool, sign into your account and type in the handle of the user profile you'd like to track.
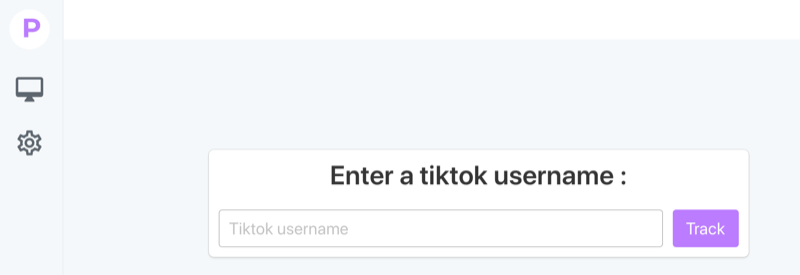
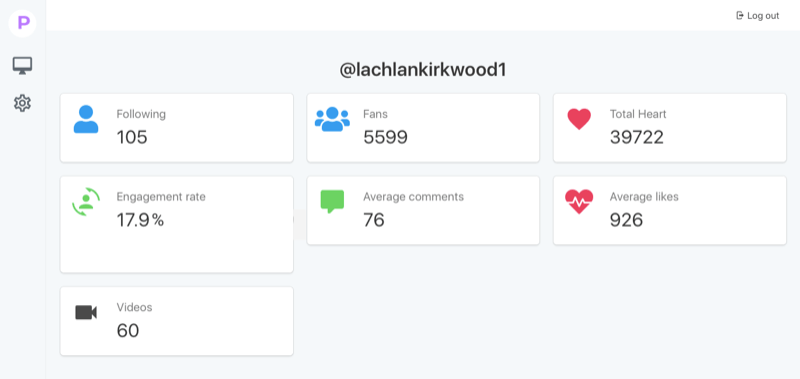
You'll then see a dashboard displaying the data for that TikTok account. This data includes:
- Average engagement rate for the profile
- Total hearts
- Total number of videos posted
- Average likes
- Average comments
- Total number of accounts the profile follows
Below these initial insights, Pentos displays a graph to indicate how this data is historically attributed.
You'll notice that unlike TikTok's native analytics, Pentos calculates an average engagement rate for profiles. If you're interested in partnering with an influencer, this is an important metric for your evaluation.
Based on an analysis of 15,000 TikTok profiles, Influencer Marketing Hub found the following average engagement rates based on account size:
- 0–10K: 9.38%
- 10K–100K: 8.43%
- 100K–500K: 7.23%
- 500K–1M: 4.88%
- 1M–5M: 4.99%
- 5M–10M: 3.35%
- 10M+: 3.07%
You'll notice that these average engagement rates are much higher than what you'd see on Instagram. TikTok presents a valuable opportunity for brands currently working with influencers across their digital marketing strategy.
Beyond profile analytics, Pentos also reveals insights about hashtag challenges. This is a powerful tool for brands looking to remain agile and create content for highly engaged topics. By identifying the performance of trending hashtags, you can quickly determine whether it's worth your time to create content for relevant challenges.
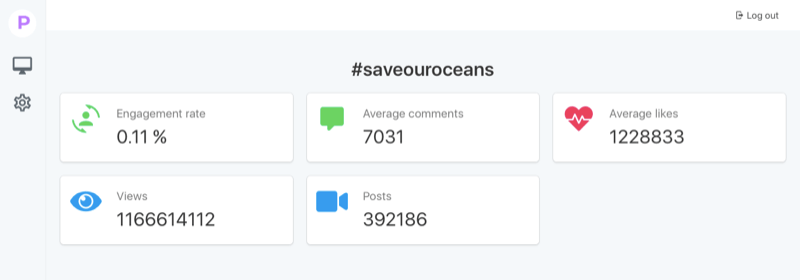
The hashtag challenge dashboard will uncover valuable insights, including:
- Average hashtag engagement rate
- Total views of hashtag content
- Total number of posts
- Average likes
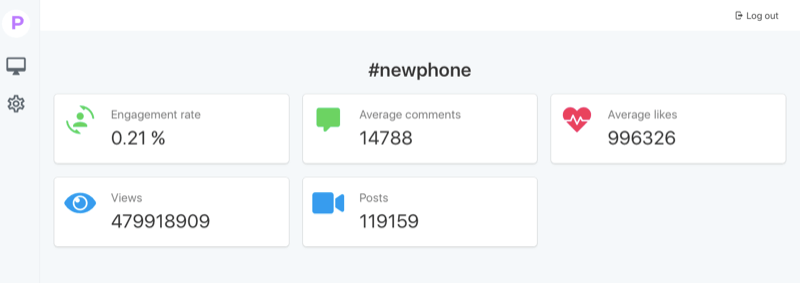
Let's say you're an eCommerce brand that sells custom phone accessories and you notice the hashtag challenge #newphone is trending across TikTok's Discover page.
Because TikTok hashtag challenges can be timely and based on current trends, it's important for you to quickly publish content before the hashtag becomes saturated or obsolete. By using the hashtag insights tool, you can identify how many total posts the hashtag currently hosts, as well as its average engagement rate.
As you can see in the analysis below, #newphone has an average engagement rate of 0.21%. As a comparison, I've found hashtag challenges to have an average of 0.15%–0.3% engagement rate overall. This data-driven approach will help you develop a more strategic path for your TikTok content.
To create a hashtag dashboard in Pentos, follow a similar setup process as for the profile analytics. Simply enter the hashtag you'd like to follow. Once validated, the dashboard will populate with up-to-date data about that hashtag.
The Pentos hashtag analytics tool can also help you measure the performance of a branded hashtag challenge you create.
Conclusion
As an emerging platform, TikTok represents a unique opportunity for brands looking to drive more engagement with younger audiences. According to Sensor Tower, TikTok received more downloads than Instagram in the first half of 2019. Over the past five consecutive quarters, TikTok has also topped the iOS App Store for overall downloads.
Although the platform hosts a large user base, one reason brands have been reluctant to add TikTok to their marketing was the lack of analytics. With no in-app analytics tool, it was difficult for brands to attribute platform outcomes from the resources they were allocating. It also meant that brands partnering with influencers weren't able to measure the effectiveness of these collaborations.
Now with the introduction of TikTok's native analytics, combined with Pentos's third-party tool, you can attribute the performance of your content across the platform.
If you've been curious to try TikTok as a social channel, now is a great time to get started. With analytics finally accessible, you can easily monitor the results from the platform and iterate your approach accordingly.
Of course, before jumping into the platform, make sure TikTok is the right fit for your brand. If your target audience doesn't include the average user of the platform, it might not be worth allocating the resources to experiment. Beyond driving just engagement, it's important to determine if the platform will help you acquire users and drive conversions.
What do you think? Will you set up a TikTok Pro account for your business? What analytics will be most relevant to you? Share your thoughts in the comments below.
More articles on TikTok marketing:
- Discover why marketers should pay attention to TikTok.
- Learn how to create TikTok video and find examples to inspire you to use TikTok in your own marketing.

Curious About How to Use AI?
Our newest show, AI Explored, might be just what you're looking for. It's for marketers, creators, and entrepreneurs who want to understand how to use AI in their business.
It's hosted by Michael Stelzner and explores this exciting new frontier in easy-to-understand terms.
Pull up your favorite podcast app and search for AI Explored. Or click the button below for more information.
