Wondering whether your YouTube shorts, remixes, or videos are working for you? Having trouble finding the YouTube analytics you need?
In this article, you’ll learn how to analyze all types of YouTube content.
YouTube Studio Analytics: What’s New for 2022?
In May 2022, YouTube announced a series of new analytics features and a complete redesign of the platform’s channel-level analytics. These new Youtube metrics features began rolling out in the first half of 2022. As of September 2022, all channels should have access to them in YouTube Studio.
According to YouTube’s Creator Insider channel, the changes largely came about because of the growing popularity of Shorts with YouTube viewers. With the redesigned YouTube Studio analytics, creators can more easily differentiate shorts from other channel content and glean more useful insights.
Although YouTube Studio has released several new features and redesigned existing options, the platform hasn’t removed any analytics. That means you can still find all of the data you’re accustomed to reviewing in YouTube Studio, as long as you know where to look for it in your YouTube account.
#1: Channel-Level Content Analytics
You can find the biggest update to YouTube Studio analytics at the channel level. In the past, when you opened YouTube Studio and selected Analytics from the left-hand menu, you would have seen Reach and Engagement tabs to the right of the Overview tab.
The Reach and Engagement tabs no longer appear in YouTube Studio’s channel-level analytics. In their place, the Content tab is your destination for all reach and engagement metrics related to the content you’ve published.
YouTube Studio automatically customizes the Content tab for your channel analytics based on the type of content you publish. If you stick to long-form content, for example, you’ll only see the Videos chip at the top of the tab. But if you publish shorts, livestreams, or community posts, relevant chips will appear in your account. Let’s take a look at the available metrics.
All-Content Metrics
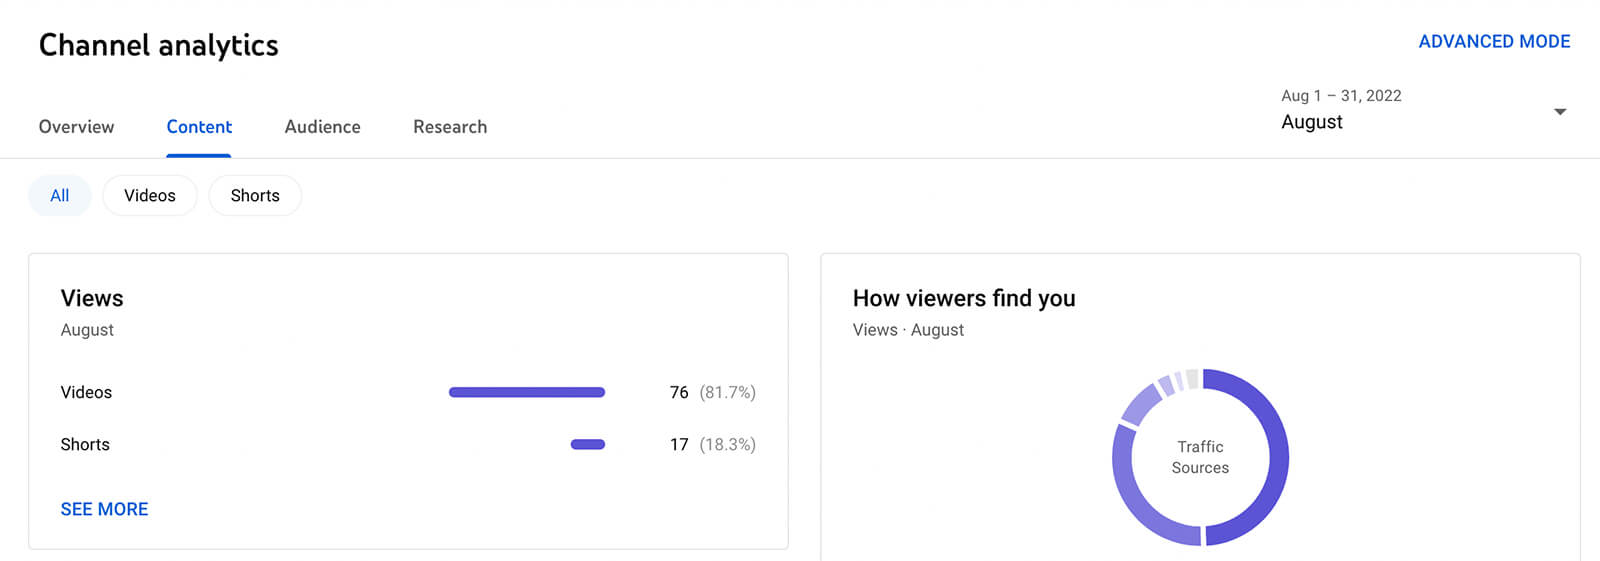
Select the All chip on the Content tab to see an overview of all your channel’s content and compare results from different types of content. To find out which type of content is getting the most traction, take a look at the Views panel.
Here, you can see a tally of all the views your channel has generated, broken down by content type. Between the bar graph and the percentage breakdown, you can easily pinpoint the most popular type of content for your channel.
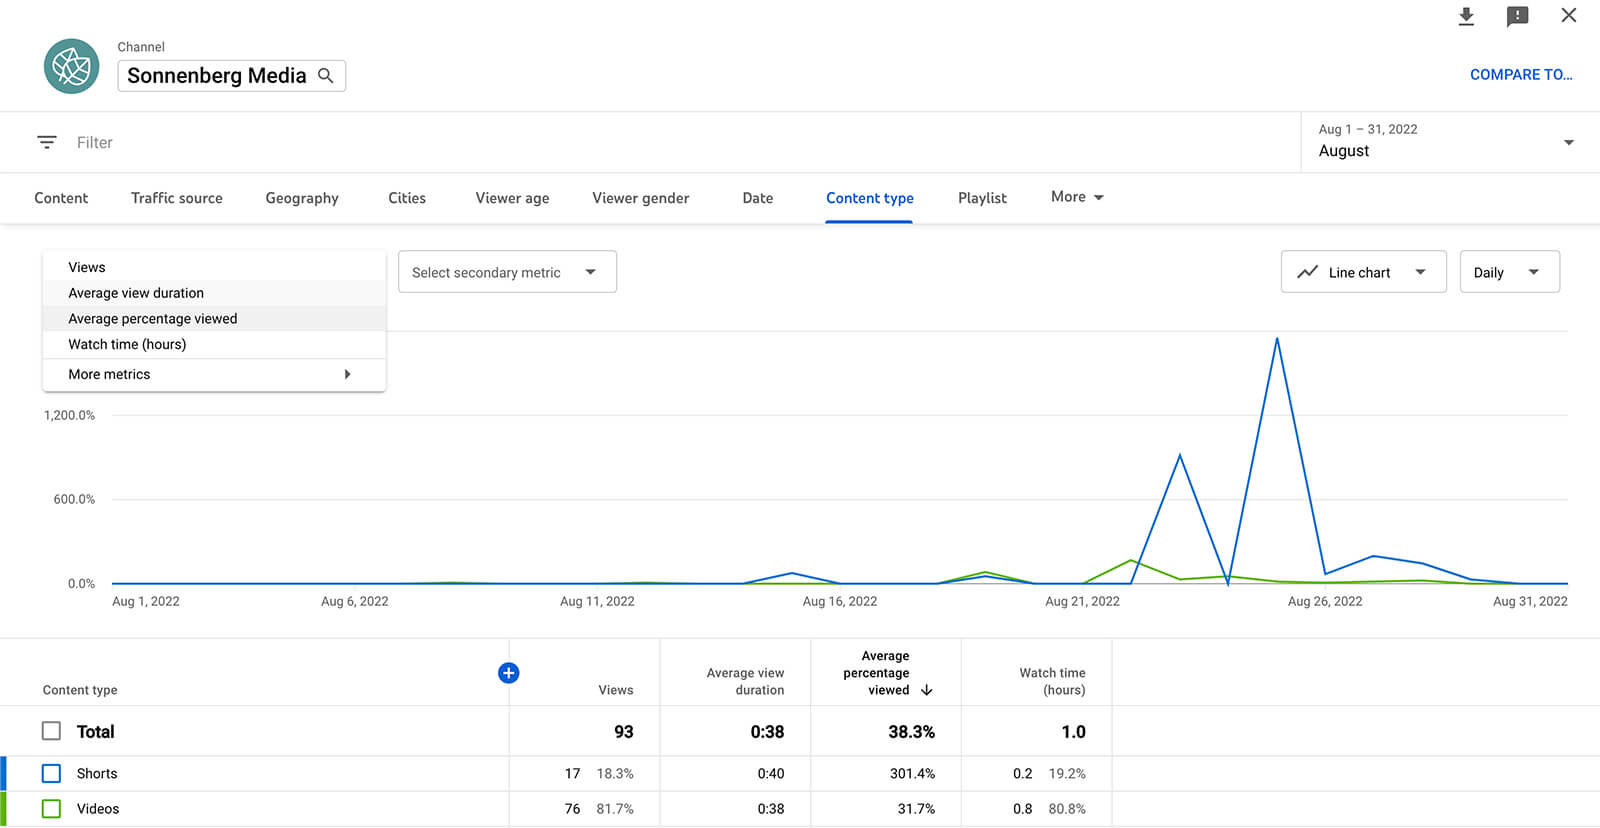
Click the See More link to access advanced view analytics. Here, you can isolate certain content types or compare two or more against each other. You can also use the drop-down menu to display other metrics like average view duration and watch time.
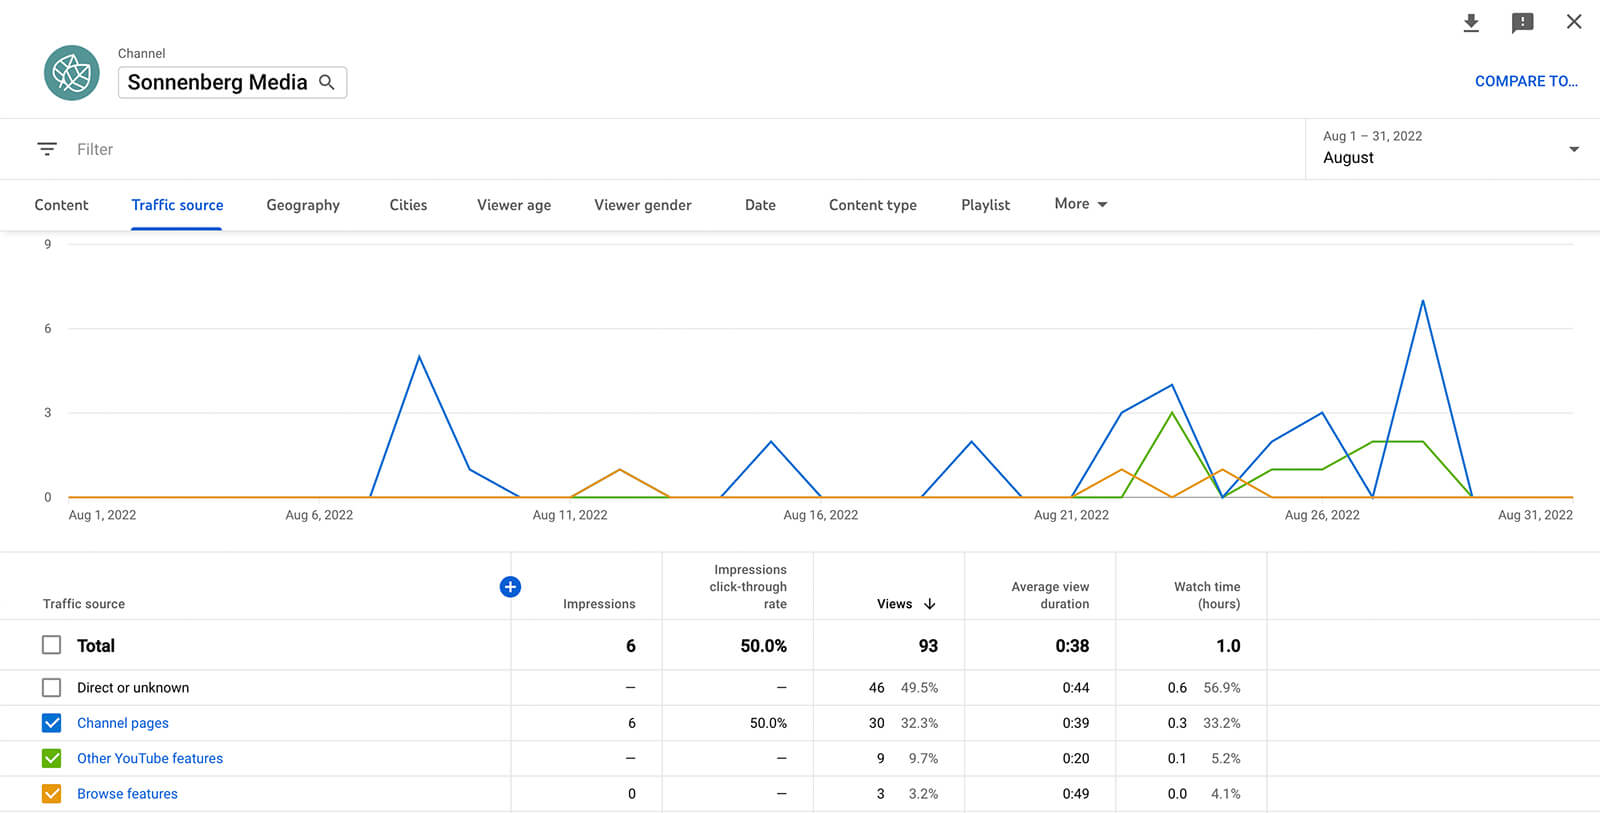
The All chip also gives an overview of how viewers find your channel’s content—from internal YouTube sources to external sites. This report is ideal for getting a big-picture look at where your traffic comes from so you can make sure you’re leveraging key opportunities.
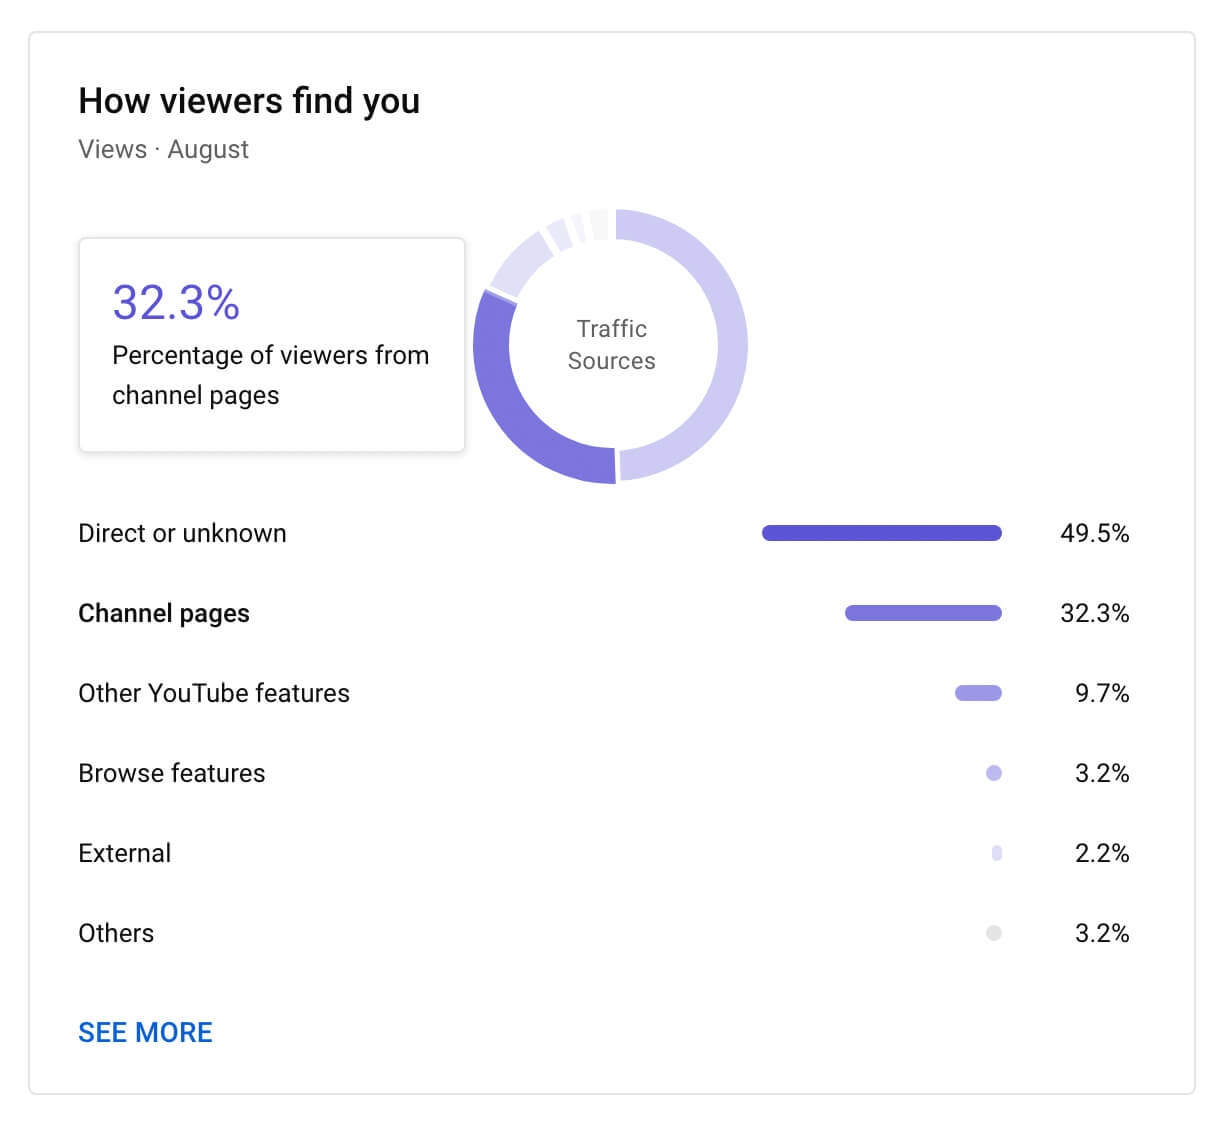
Click the See More link to get an in-depth look at where your channel’s traffic comes from. Like the Views report, the Traffic Source report lets you zero in on the data that’s most important to you, like native YouTube features.
For each traffic source, you can also see impressions, impression click-through rate (CTR), average view duration, and other key metrics. With this data, you can get a better sense of the traffic sources that drive the most value for your channel.
Get World-Class Marketing Training — All Year Long!
Are you facing doubt, uncertainty, or overwhelm? The Social Media Marketing Society can help.
Each month, you’ll receive training from trusted marketing experts, covering everything from AI to organic social marketing. When you join, you’ll also get immediate access to:
- A library of 100+ marketing trainings
- A community of like-minded marketers
- Monthly online community meetups
- Relevant news and trends updates
If your team produces multiple types of content, you know that comparing shorts to long-form videos and livestreams isn’t always helpful. To view metrics for each type of content separately, select one of the chips at the top of the Content tab.
Video Metrics
At the top of the Videos chip, you can see an overview of the views, impressions, impression CTR, and average view duration for your long-form content. Click on any of these tabs to see the full chart.
YouTube Studio automatically adds icons to indicate the dates you published long-form videos. You can hover over any of these icons to see the video title and thumbnail. You can click the chart icon in the pop-up to view analytics for the video.
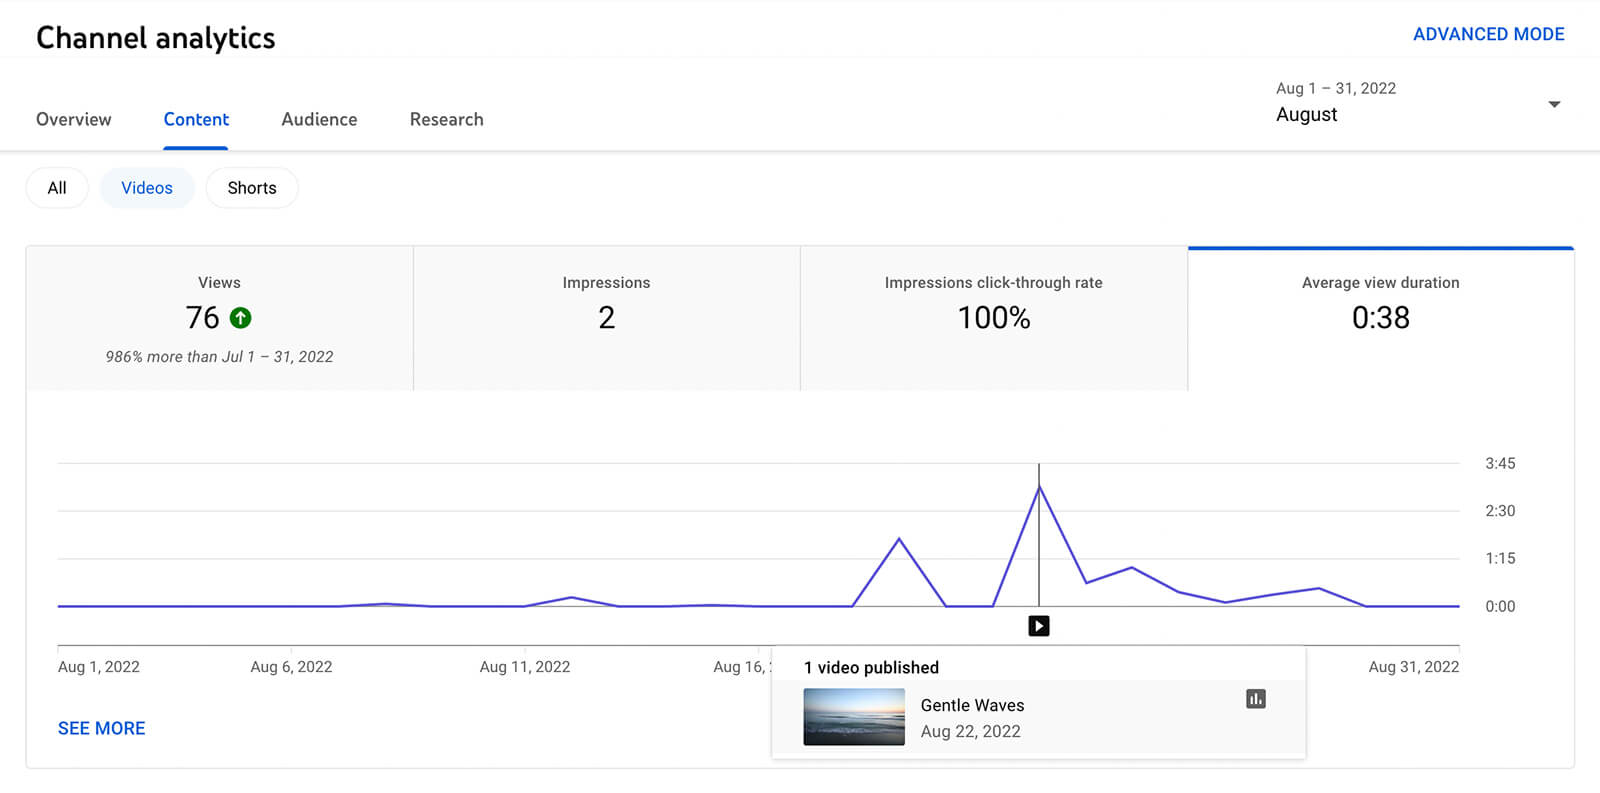
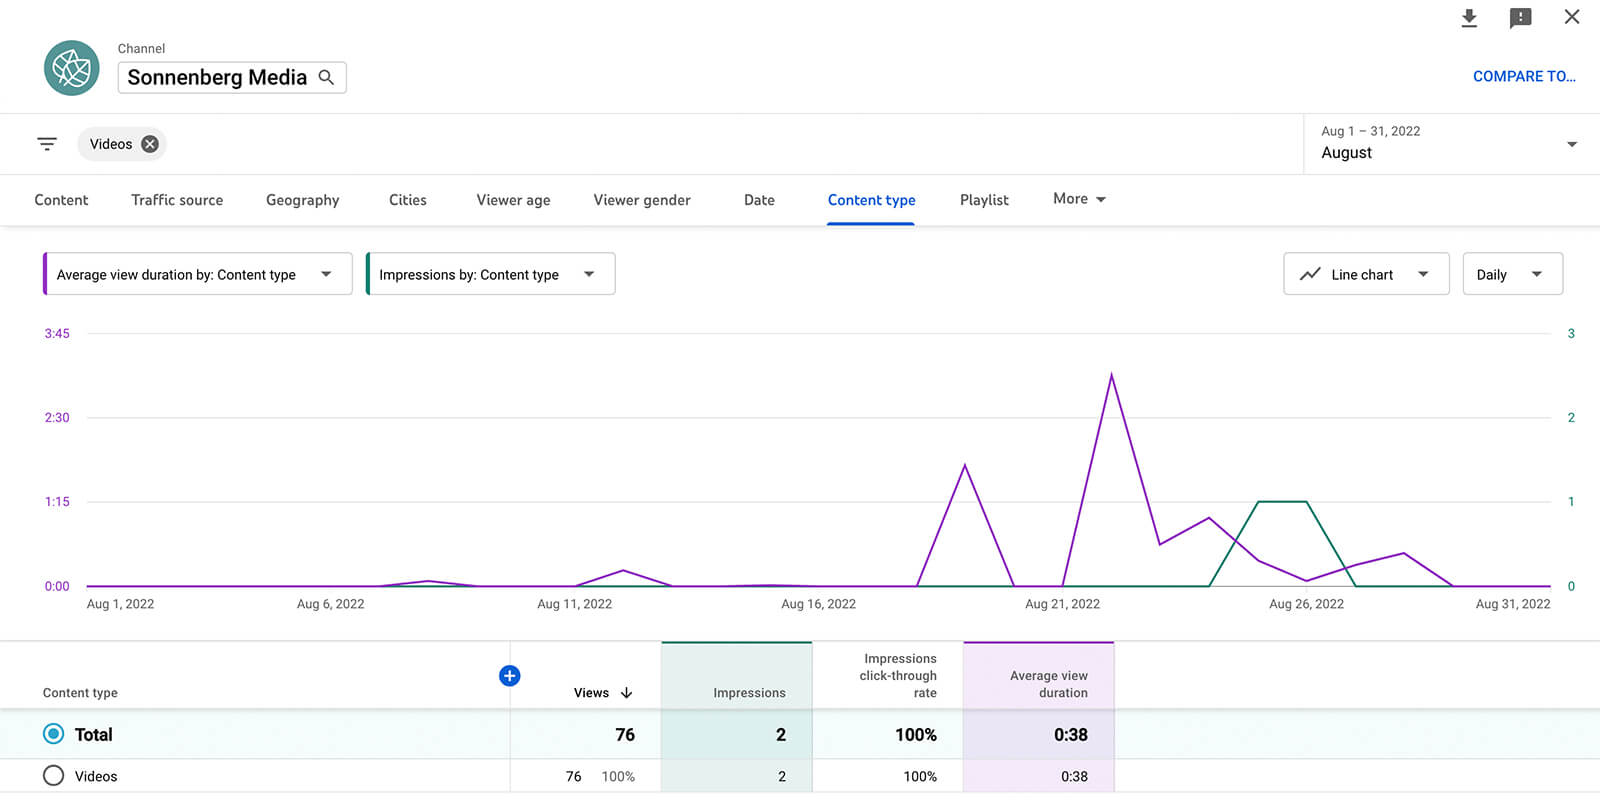
To get more value from your long-form video data, click the See More link in the lower-left corner of the chart. Then select up to two metrics to review and look for patterns.
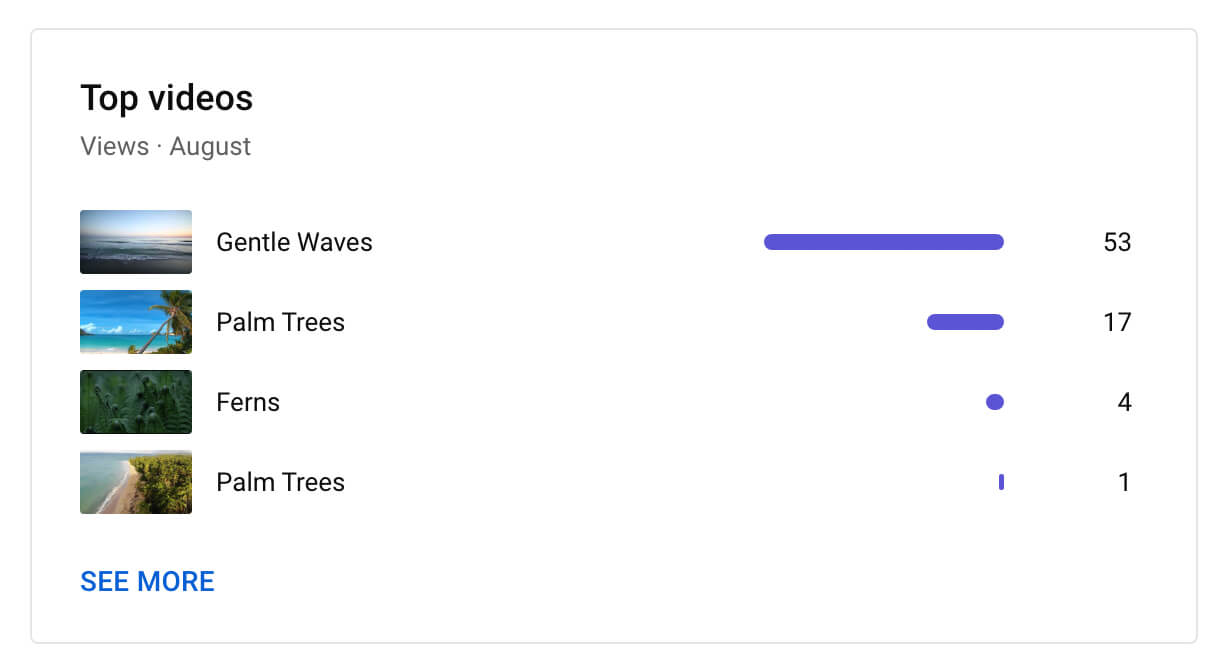
Back on the main Videos chip, you can see traffic sources and top content exclusively for long-form content.
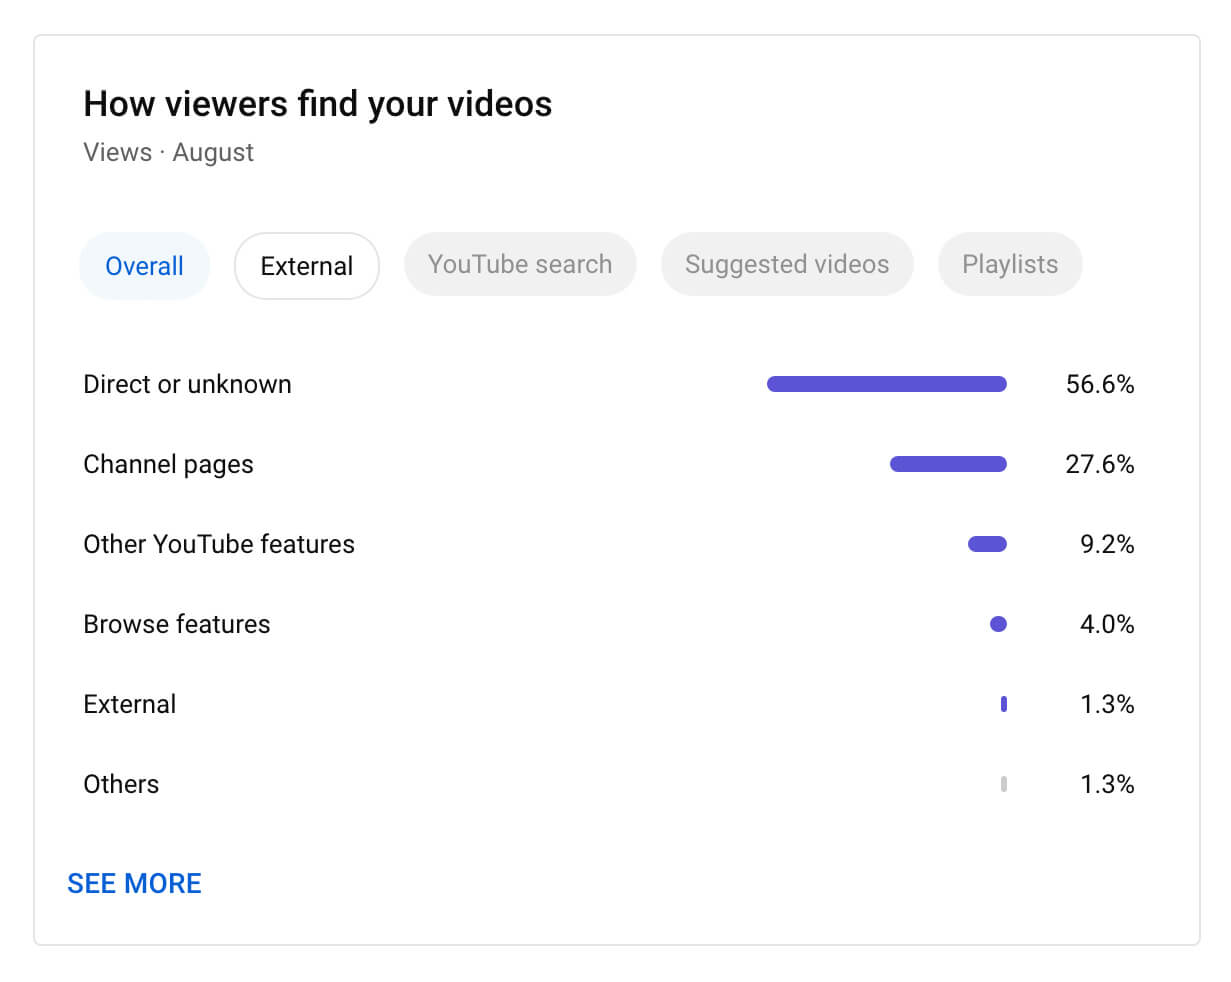
You can expand either panel to see a customizable chart and you can also click on any of the top videos to see individual content metrics.
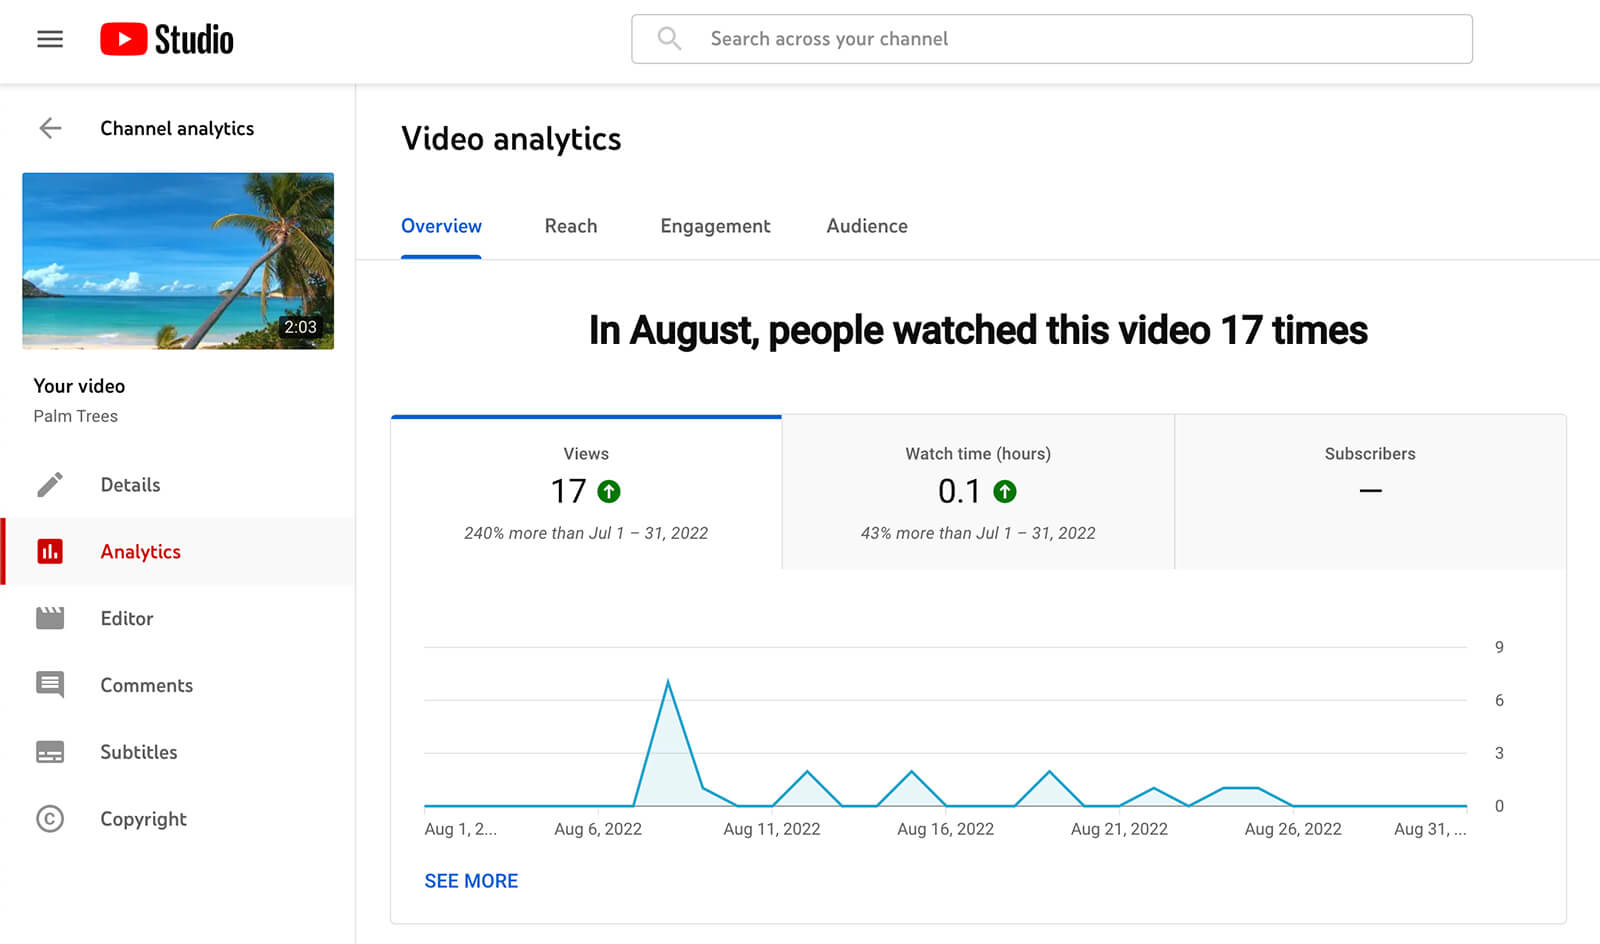
Unlike channel-level analytics, video-level analytics haven’t changed. In addition to the Overview tab, you can still access the Reach and Engagement tabs to see all of the states for individual videos.
Shorts Metrics
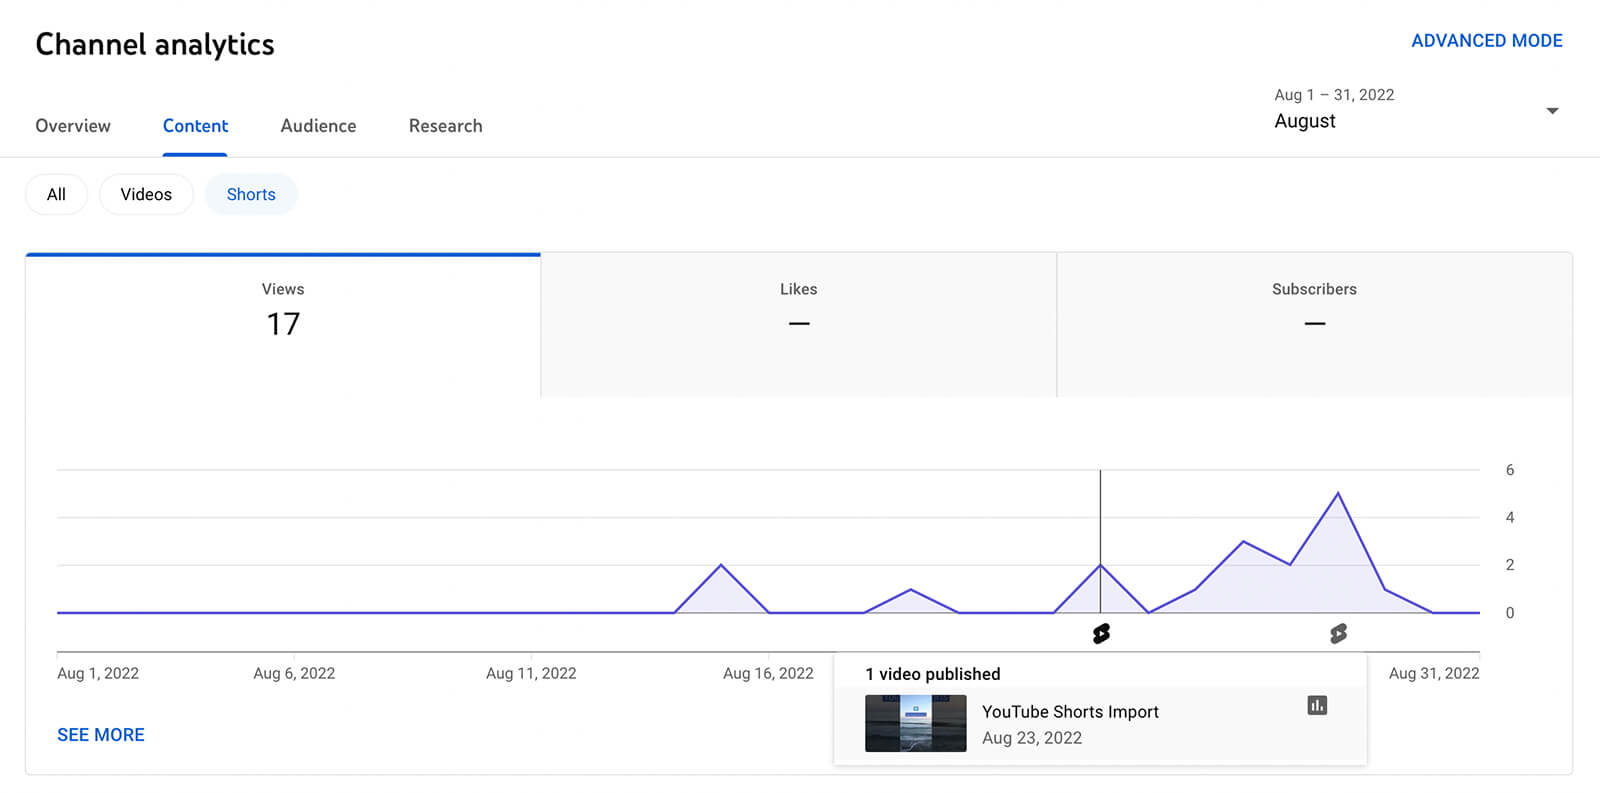
The data on the Shorts chip looks similar but it lets you take a closer look at your short-form content instead. You can click through the Views, Likes, and Subscribers tabs to see the impact of your shorts. Hover over any shorts icon at the bottom of the chart to see what was published on any given day and click the chart icon to view analytics for the individual short.
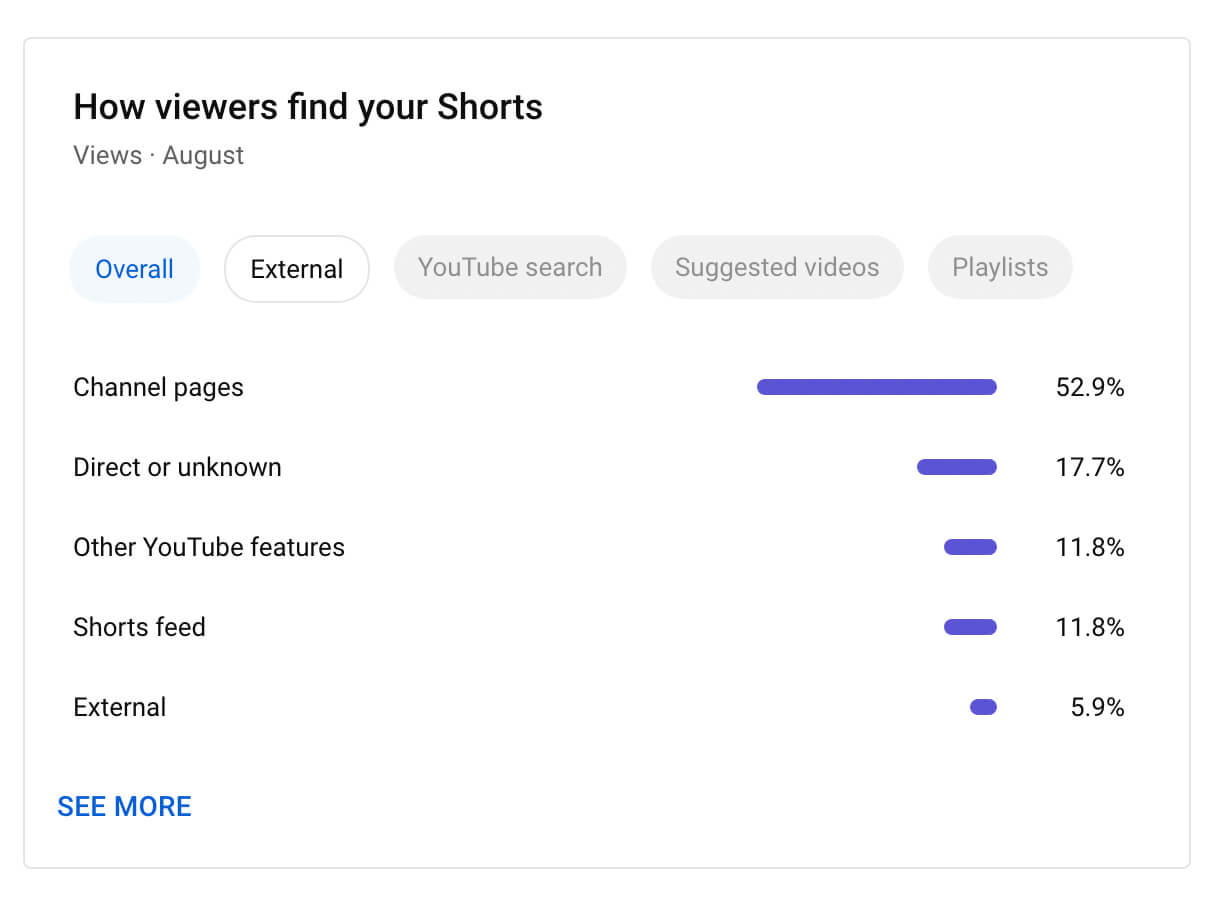
After taking a look at the Shorts overview, scroll down to see the traffic sources for your short-form content. Do your Shorts viewers tend to come from the same traffic sources as your long-form video viewers? It’s helpful to know which traffic sources are most valuable so you can promote your channel in the most effective places.
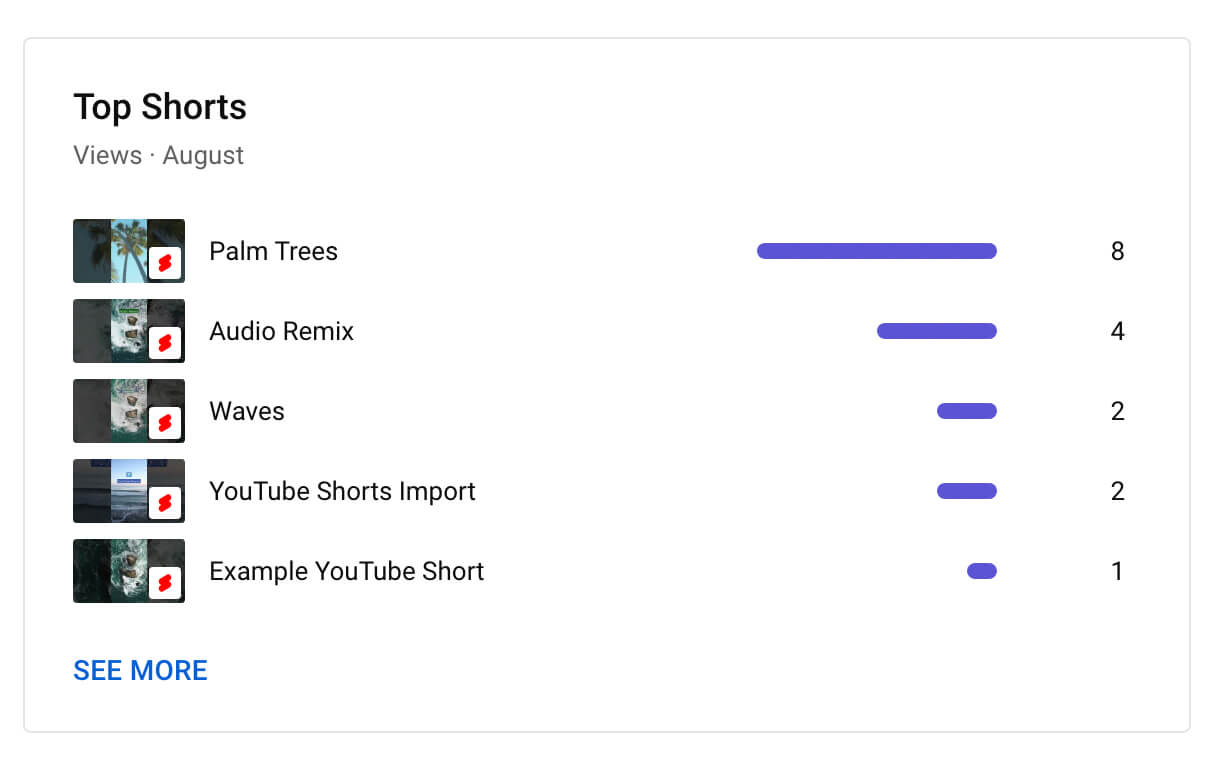
Like the Videos chip, the Shorts chip also has a top content report that displays your top five shorts from the selected time period. You can click any of the top shorts to view individual video analytics or click the See More link for in-depth analytics. Here, you can highlight individual videos and customize metrics so you can focus on what matters to your team.

Discover Proven Marketing Strategies and Tips
Want to go even deeper with your marketing? Check out the Social Media Marketing Podcast! Publishing weekly since 2012, the Social Media Marketing Podcast helps you navigate the constantly changing marketing jungle, with expert interviews from marketing pros.
But don’t let the name fool you. This show is about a lot more than just social media marketing. With over 600 episodes and millions of downloads each year, this show has been a trusted source for marketers for well over a decade.
Live Metrics
If your team hosts livestreams, you’ll also see a Live chip at the top of the Content tab. The Live chip makes it easy to see views, impressions, and impression CTR for all of the livestreams you’ve hosted.
Want to see which livestreams have retained your audience the longest? YouTube Studio displays average view duration analytics for the original stream and replays so you can assess how your audience is engaging in real time and after the event.
Like the other content chips, the Live chip also has panels that reveal your channel’s top lives and how viewers find your content. You can click the See More link in any panel to view advanced analytics.
Note that when you view advanced analytics by content type, you can only see data from January 2022 forward. If you want to see all of your channel’s data, click to remove the content type filter.
Post Metrics
If your team publishes community posts to your channel, you’ll also see a Posts chip at the top of the Content tab. In addition to showing impressions and other key metrics, the Posts chip lets you view top posts by type including polls, images, and more.
Remix Metrics
When you want to view any advanced analytics—including data on playlists, cards, and endscreens—you have to check the desktop version of YouTube Studio. But if you only need to see basic analytics, the YouTube Studio mobile app has all of the essential overviews.
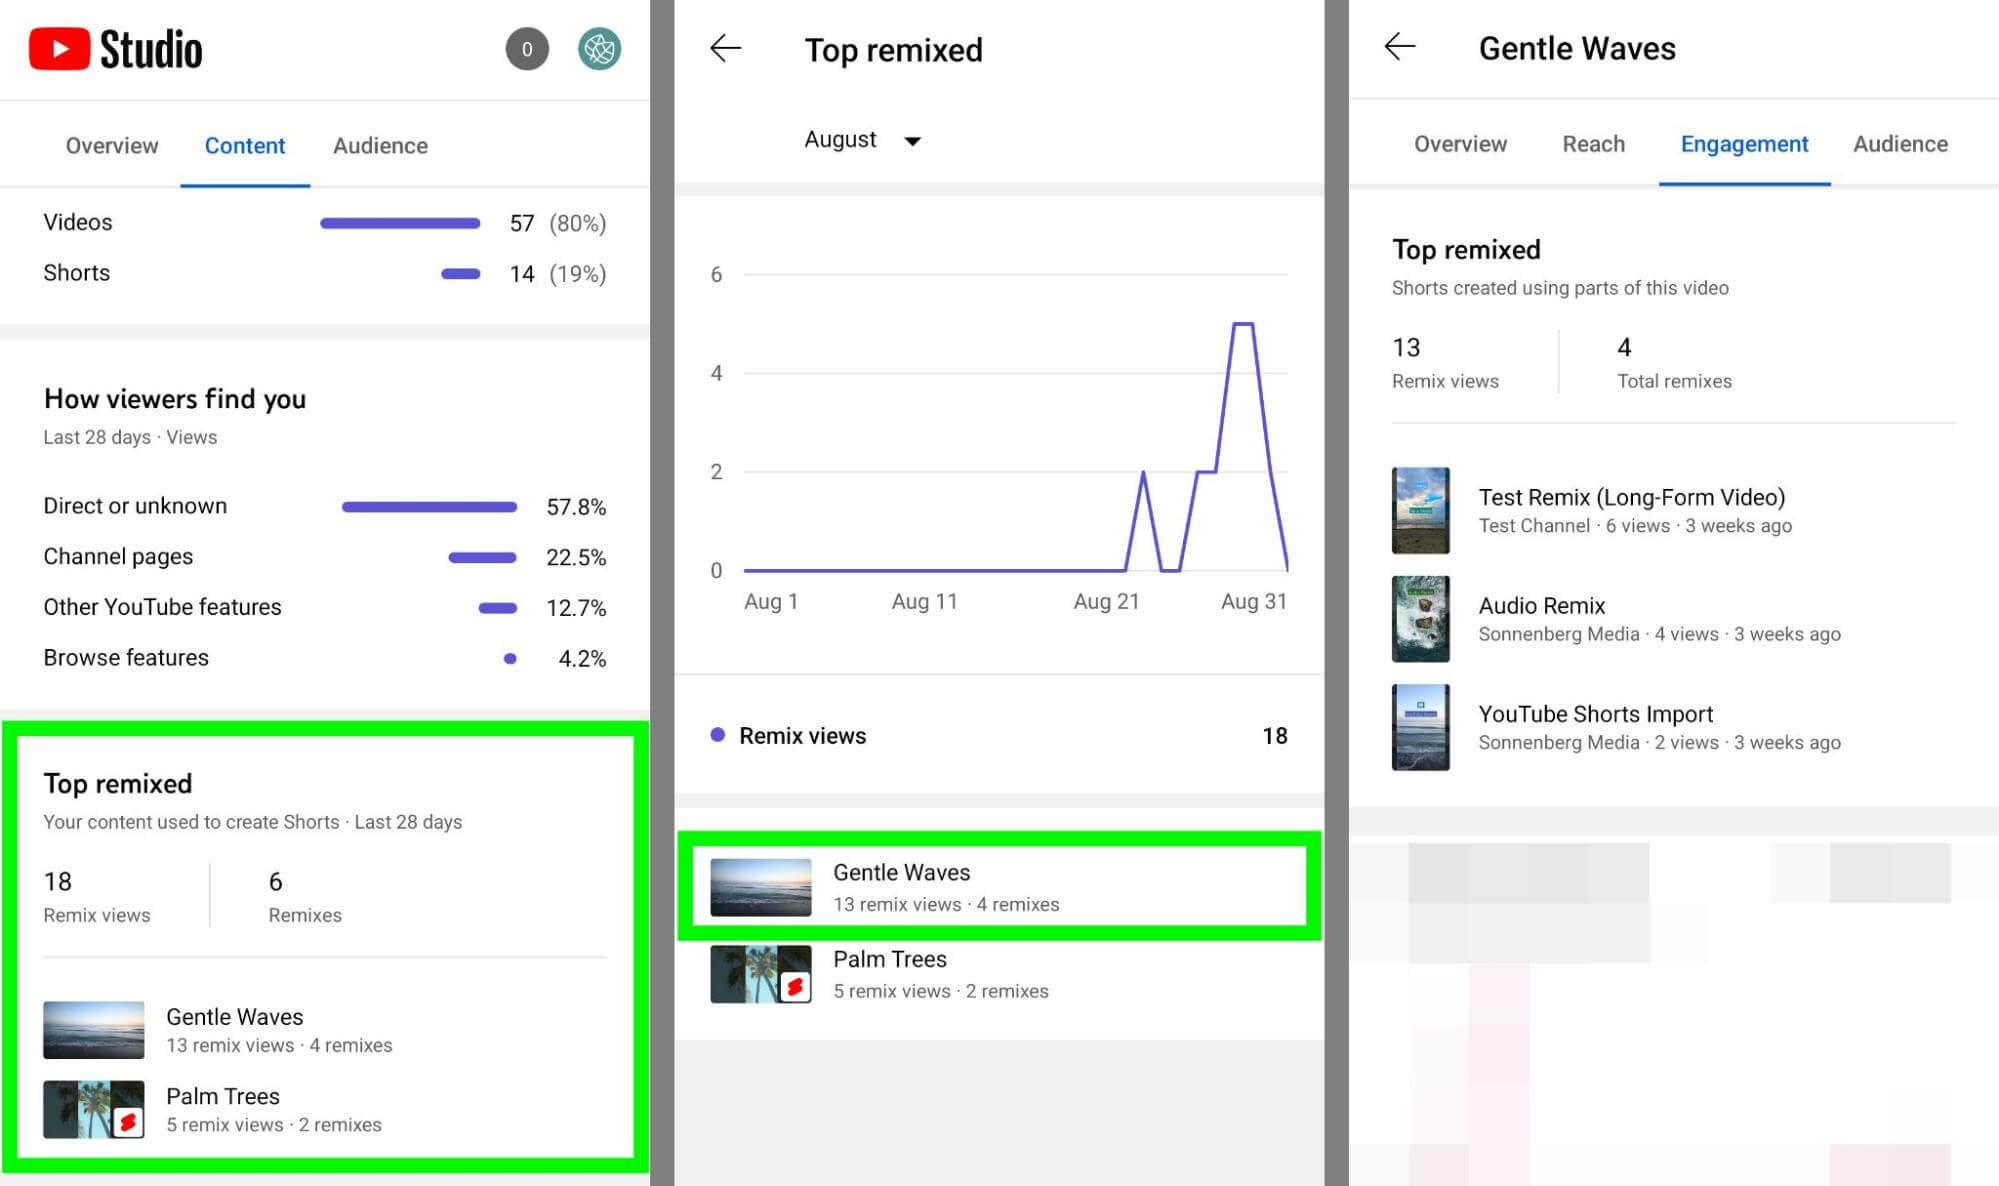
The YouTube Studio mobile app also has one type of analytics that the desktop version doesn’t offer. If you want to see how other YouTube users are repurposing your video content into shorts, check the Remix analytics in the YouTube Studio mobile app. You can find this data at the bottom of the Content tab.
The Top Remixed overview reveals the number of remixes and the total number of views these videos have generated. Tap the panel to see a time-based chart of Remix views and a list of channel content that other users have remixed.
From there, you can tap any video and go to the video-level Engagement tab to see Remix details. Tap any remix to open it directly in YouTube and see firsthand how other channels have engaged with your content.
#2: Auto-Translate Metrics
Whether you want to educate, entertain, or engage viewers, it’s important to create video content that your target audience can understand. With YouTube Studio’s subtitle analytics, you can see whether viewers watching your content use closed captions (CC). You can also identify which language settings they're using.
Channel-Level Auto-Translate Metrics
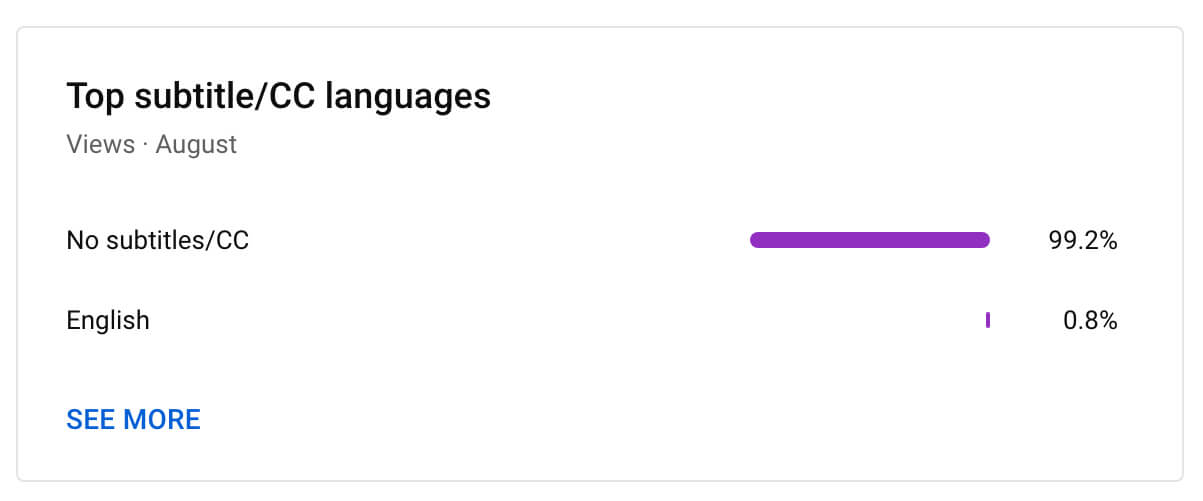
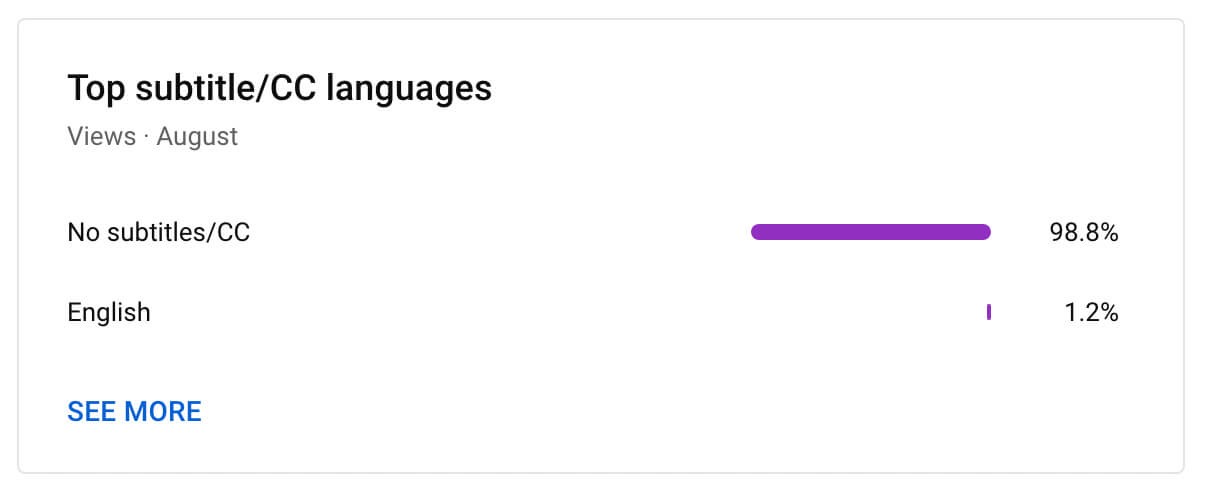
To view your channel’s CC analytics, open your YouTube Studio dashboard and select Analytics in the left-hand menu. Then go to the Audience tab and scroll down to the Top Subtitle/CC Languages panel. Here, you can see a breakdown of the percentage of people using various subtitle language settings.
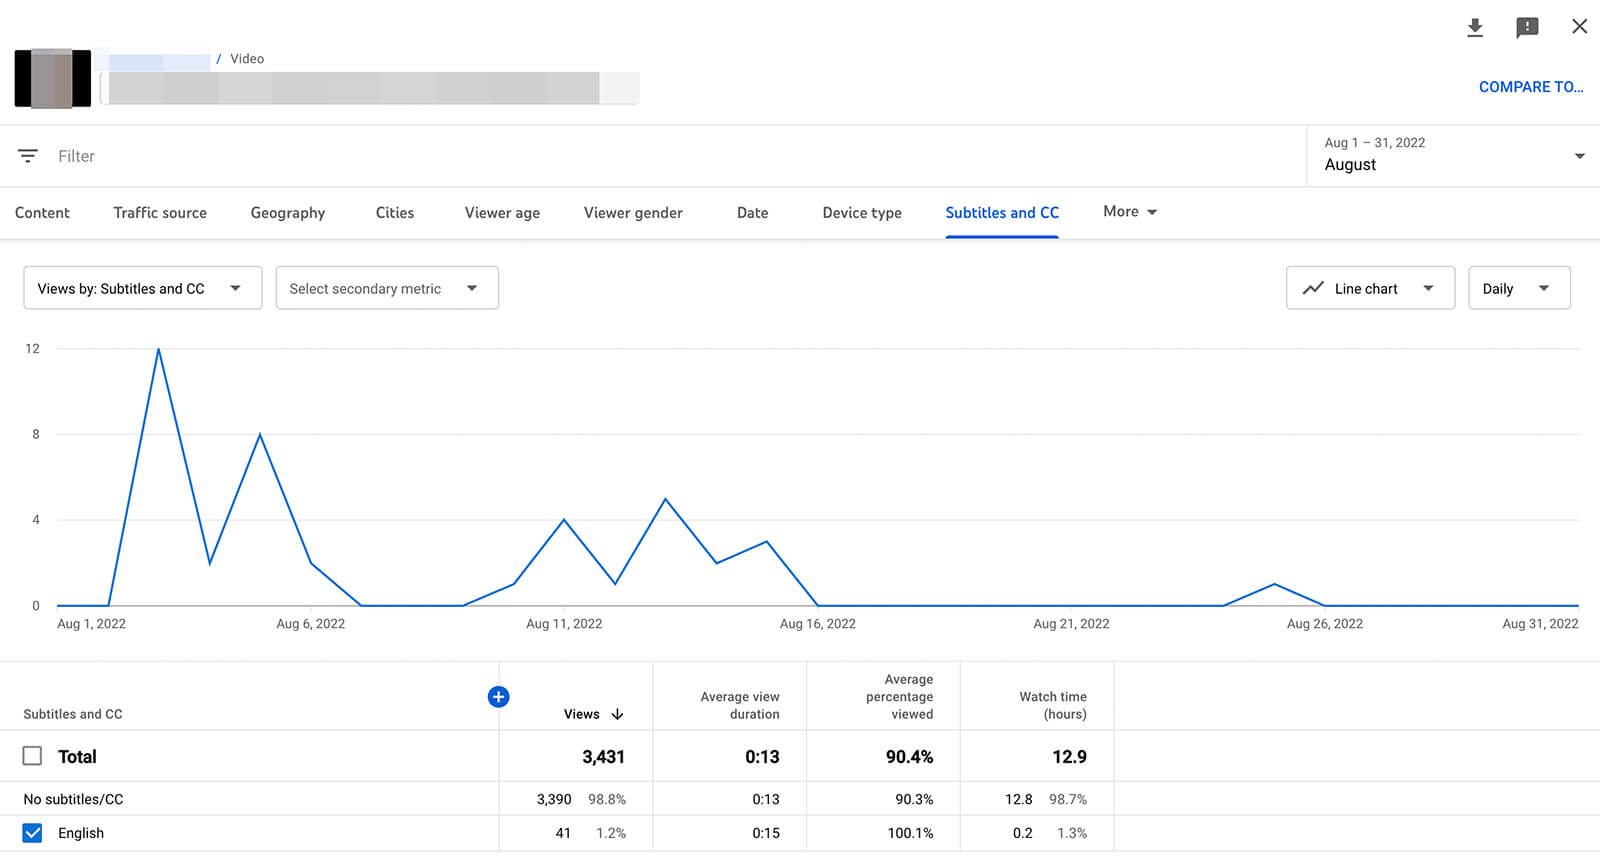
Click the See More link to view your channel’s subtitle analytics in chart format. Here, you can see a visual comparison of the various language settings your audience used on a daily, weekly, monthly, or yearly basis. To isolate a single language or to compare two languages, click the checkbox to the left of your preferred options.
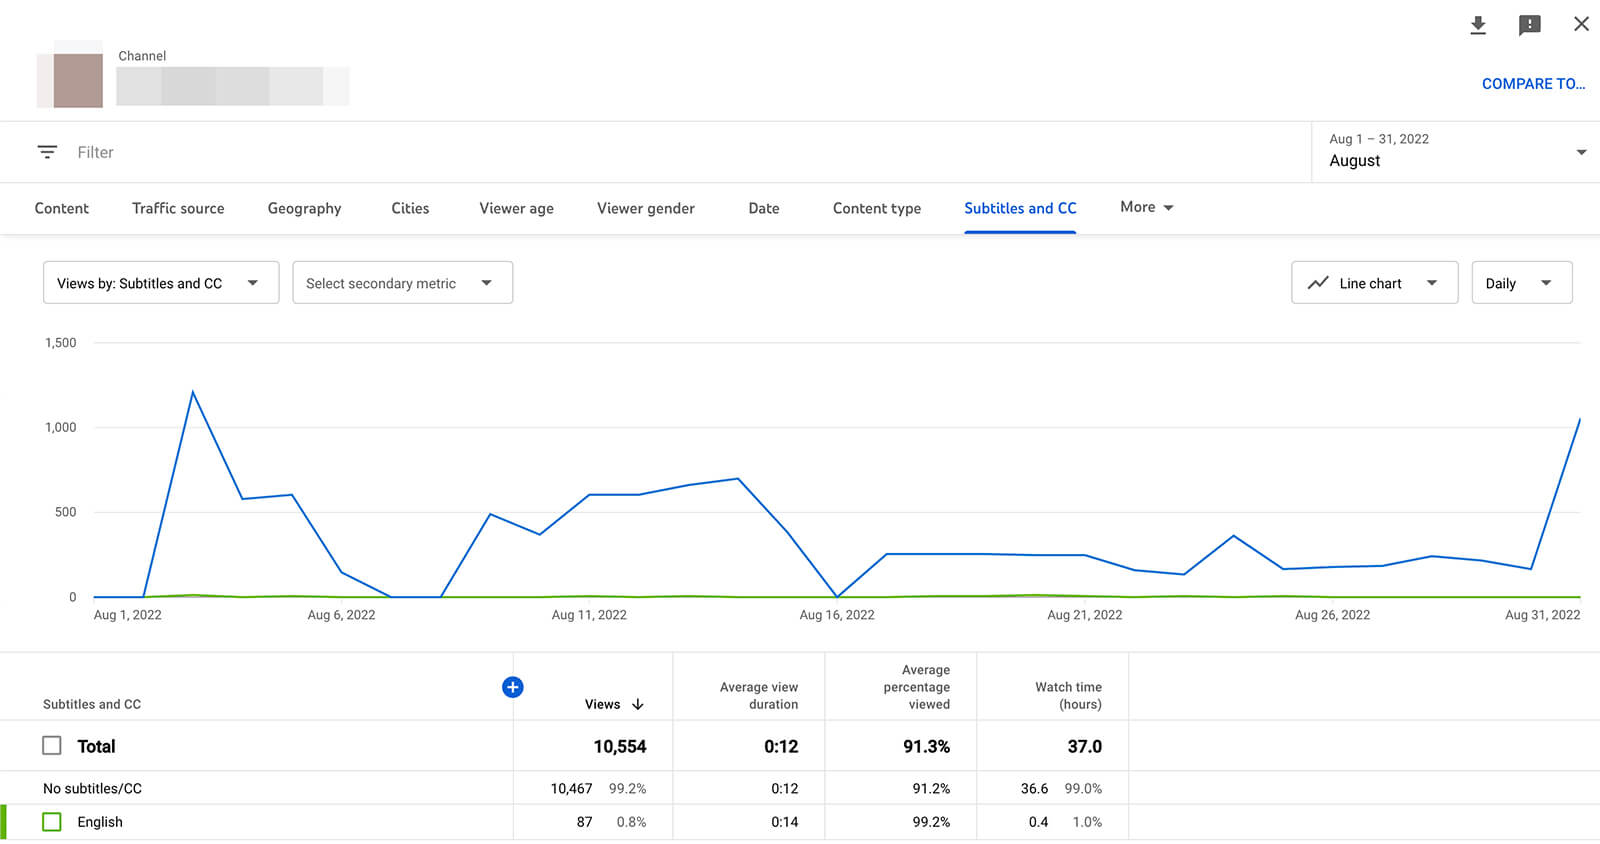
The Subtitles and CC chart also shares detailed metrics for each language. For example, you can see the average view duration and average percentage viewed for each subtitle language. You can use these metrics to make better decisions about the captions you add to your channel content so you can invest resources appropriately.
Video-Level Auto-Translate Metrics
Curious about the top subtitle languages for individual videos? Go back to your YouTube Studio overview and open the Content tab. Select any video and navigate to the video’s Audience tab. Then scroll down to view the Top Subtitle/CC Languages panel for the video.
Like the channel-level panel, the video-level panel provides detailed metrics for each language. You can also isolate a single language or compare two or more for more nuanced insights.
Note that you can view channel- and video-level auto-translate metrics in the YouTube Studio mobile app but the app only displays a percentage breakdown. To view charts or look for patterns over time, use the desktop version of YouTube Studio instead.
#3: Popular Segments Graph
YouTube content analytics can tell you a lot about the types of videos your audience likes and dislikes. But if you create long-form content, identifying best- and worst-performing videos doesn’t always provide you with enough detail. It’s also helpful to find the chapters or segments that resonate most with your audience.
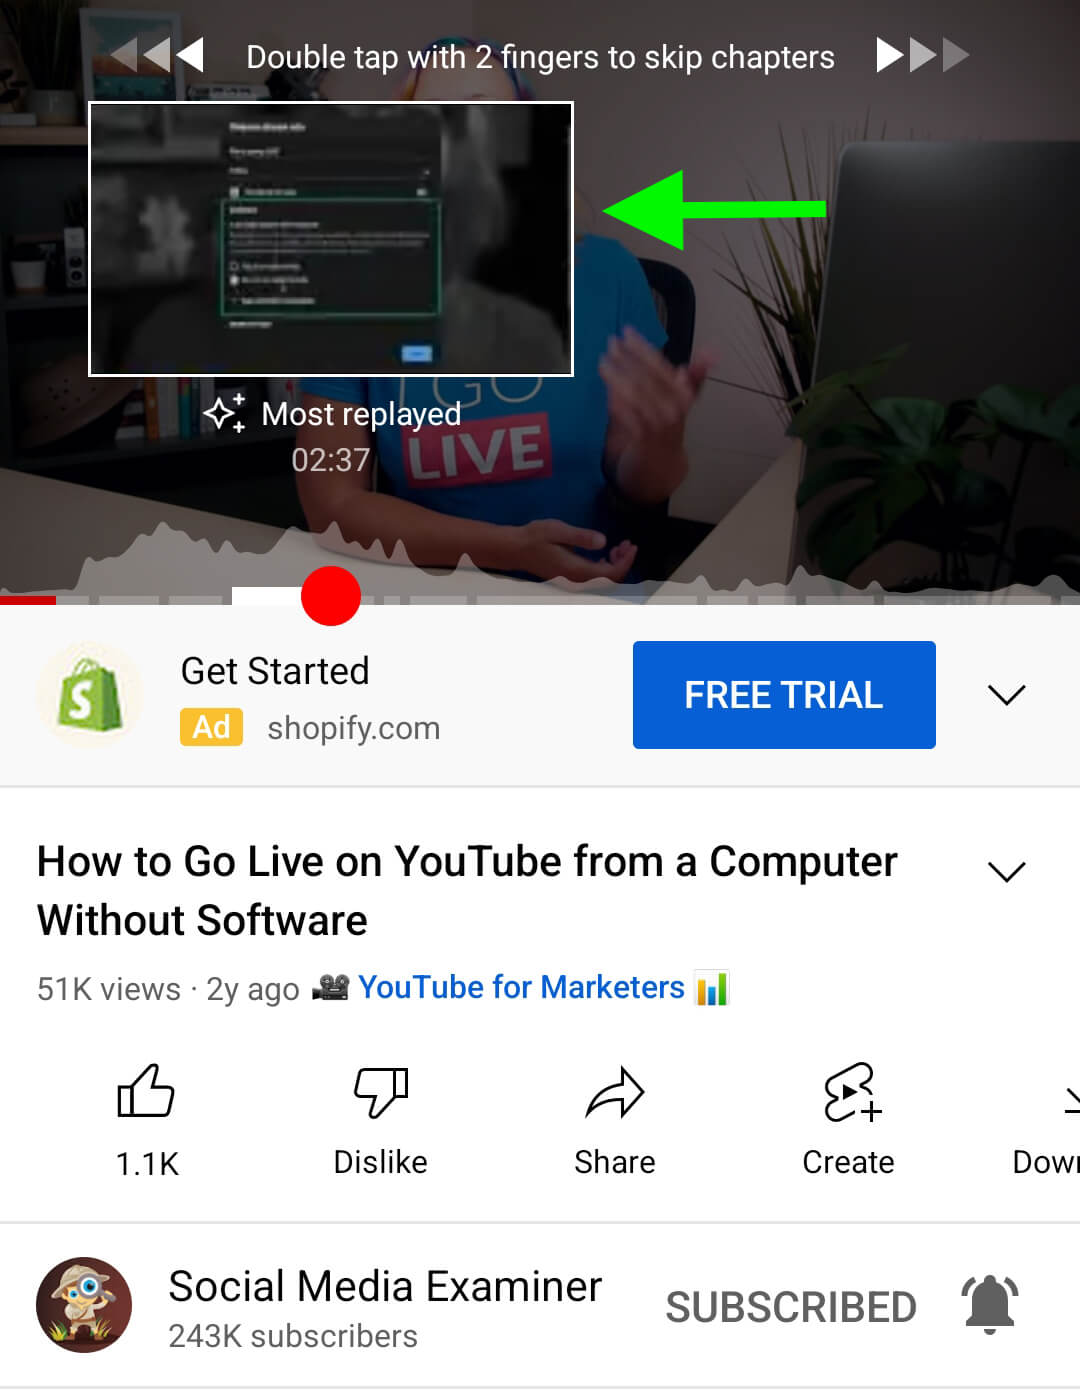
With YouTube’s popular segments graph, you can easily identify the most replayed parts of a video. To access this graph, open a video in YouTube, either on desktop or in the mobile app. Then hover over the video on desktop or drag the scrollbar in the mobile app.
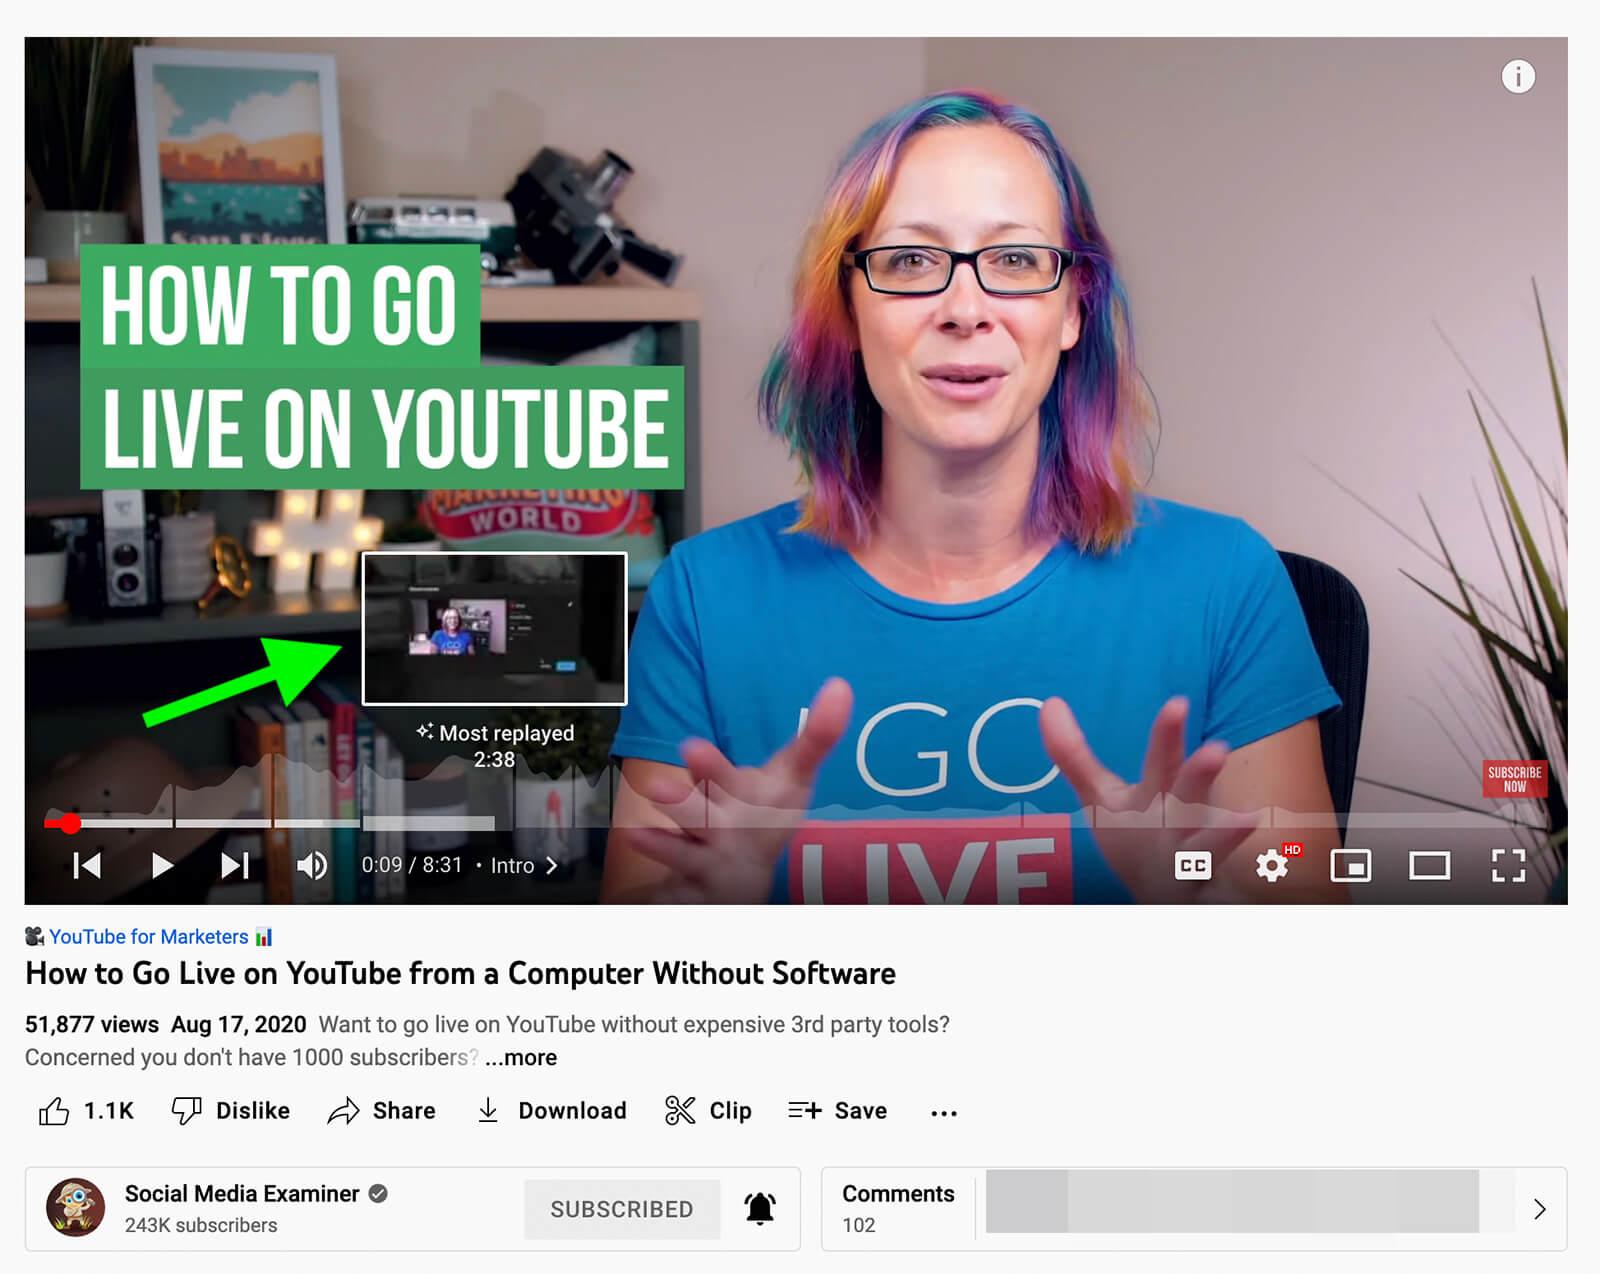
Videos display a graph that spans the entire timetable, with peaks showing the most popular (i.e., most frequently replayed) sections. The higher the peak, the more replays the part has generated. To designate the most popular part, YouTube displays a Most Replayed label.
Benefits of the Popular Segments Graph
By finding the most replayed part of a video, you can better understand what viewers found most valuable or most entertaining. One of the biggest perks of this feature is that it displays on YouTube for all available videos, not just for your channel’s own content.
That means you can use this tool to research other channels’ content, too. For example, you could find the most replayed sections in your competitors’ videos and use your insights to create better content for your own channel.
Potential Downsides to the Popular Segments Graph
The main downside to this feature is that it displays only when YouTube has gathered enough data to display a graph and identify the most replayed part. That means it may not be available for some of your videos. When it is, you can use it to create more compelling video content for your YouTube channel.
When launching this feature, YouTube indicated that the popular segments graph hadn’t contributed to decreased watch times for most channels. However, watch time is a metric you’ll want to monitor as more subscribers begin using the popular segments graph to inform their viewing habits.
Alternatives to the Popular Segment Graph
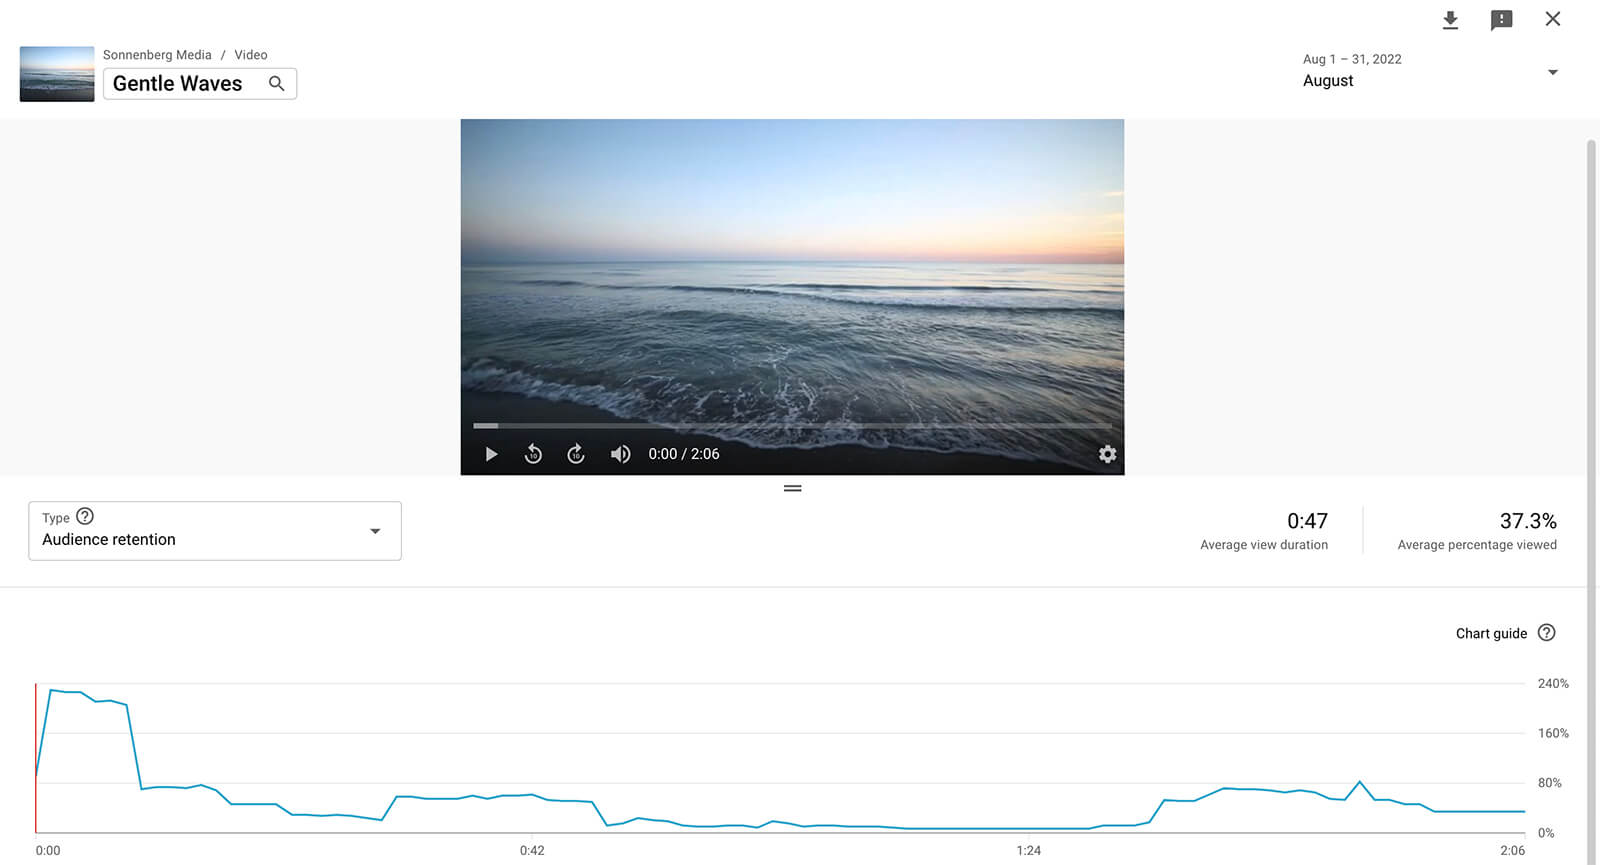
If you’re curious about popular segments for videos that don’t have enough data to display this graph, check your audience retention metrics in YouTube Studio. You can find this chart on the Overview tab for any individual video.
This section highlights the average view duration and percentage viewed for each video so you can gauge how well you’re holding viewers’ attention. In addition, the audience retention chart shows when viewers tune in and when they drop off.
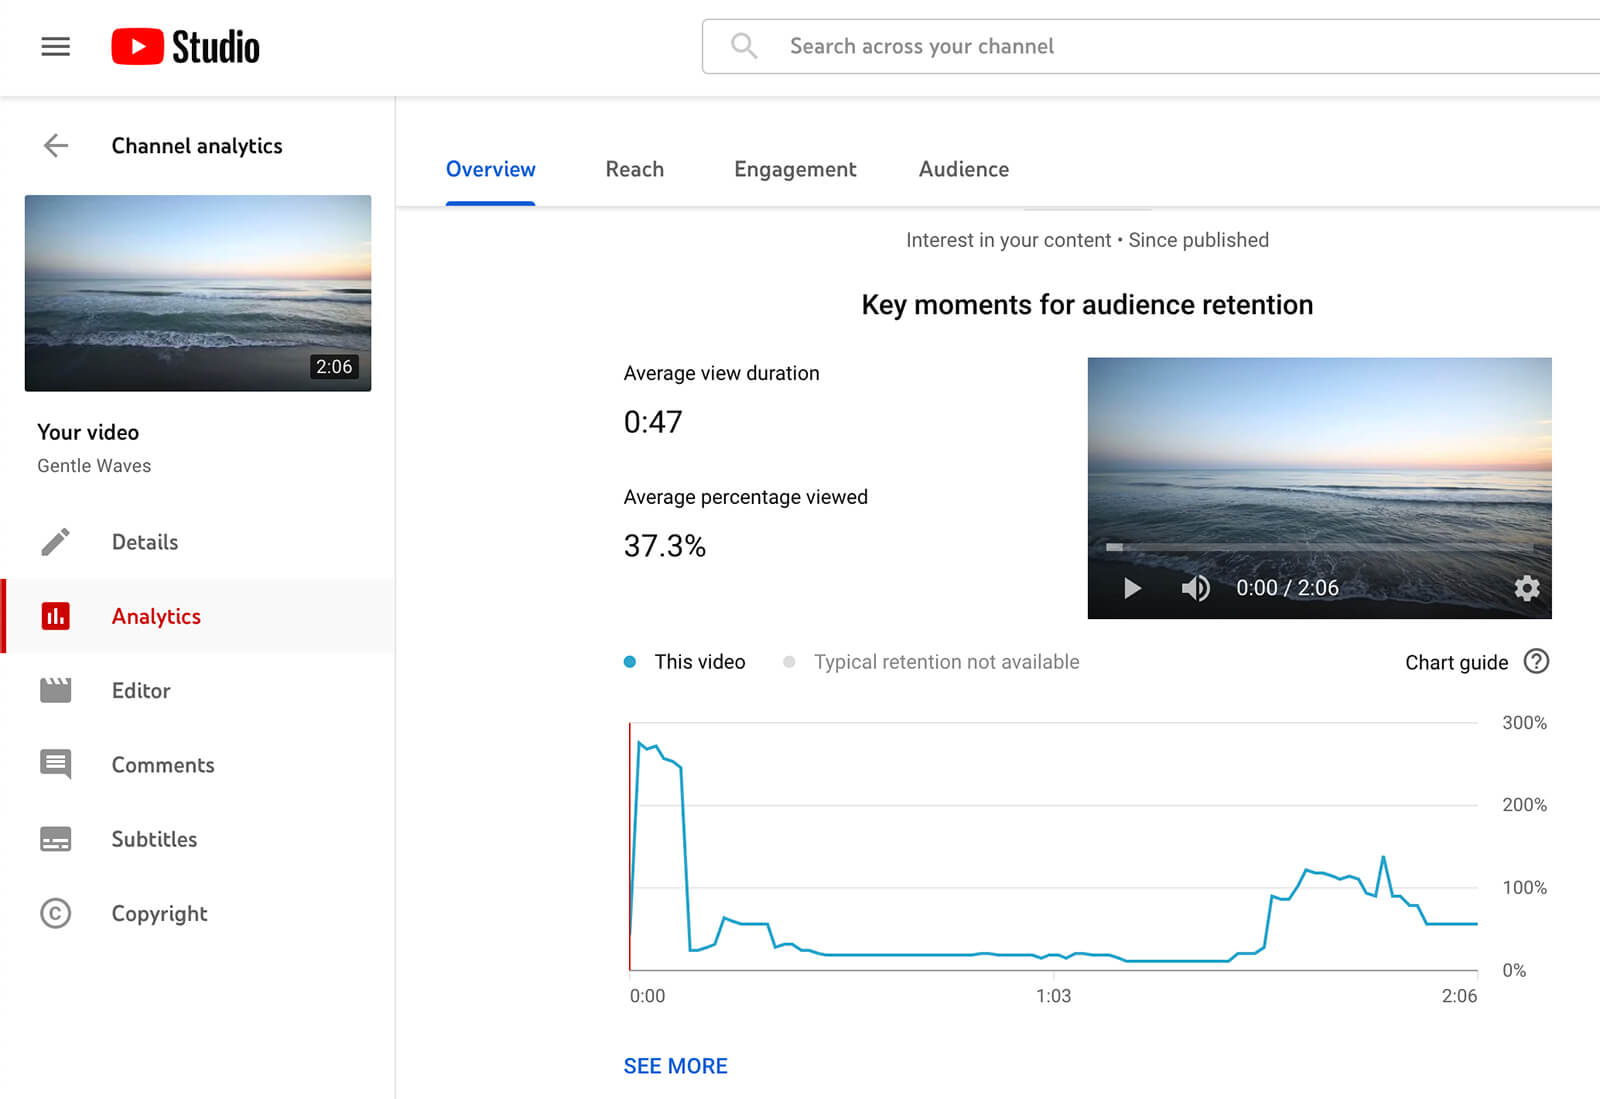
From there, you can determine what causes viewers to click away and what holds their interest. Then you can incorporate the hooks and topics that work best for your audience into future video content.
Conclusion
Whether you’re creating shorts, producing long-form videos, hosting livestreams, or experimenting with all types of content, the updated YouTube Studio analytics can make your job much easier. Using these analytics, you can monitor channel and content performance and apply your insights to produce more successful YouTube videos.
Stay Up-to-Date: Get New Marketing Articles Delivered to You!
Don't miss out on upcoming social media marketing insights and strategies! Sign up to receive notifications when we publish new articles on Social Media Examiner. Our expertly crafted content will help you stay ahead of the curve and drive results for your business. Click the link below to sign up now and receive our annual report!
Attention Agency Owners, Brand Marketers, and Consultants

Introducing the Marketing Agency Show–our newest podcast designed to explore the struggles of agency marketers.
Join show host and agency owner, Brooke Sellas, as she interviews agency marketers and digs deep into their biggest challenges. Explore topics like navigating rough economic times, leveraging AI, service diversification, client acquisition, and much more.
Just pull up your favorite podcast app, search for Marketing Agency Show and start listening. Or click the button below for more information.

