Want an easy way to analyze your Facebook ads? Wondering how to customize the metrics you see in Facebook Ads Manager?
In this article, you'll discover how to create a custom report layout in Facebook Ads Manager. You'll learn how to add, delete, and organize Facebook Ads Manager columns to show the data that matters most to you and how to save your report for quick access in the future.
To learn how to analyze your Facebook ad performance in Ads Manager, read the article below for an easy-to-follow walkthrough or watch this video:
#1: Set Up a Custom Report Layout in Facebook Ads Manager
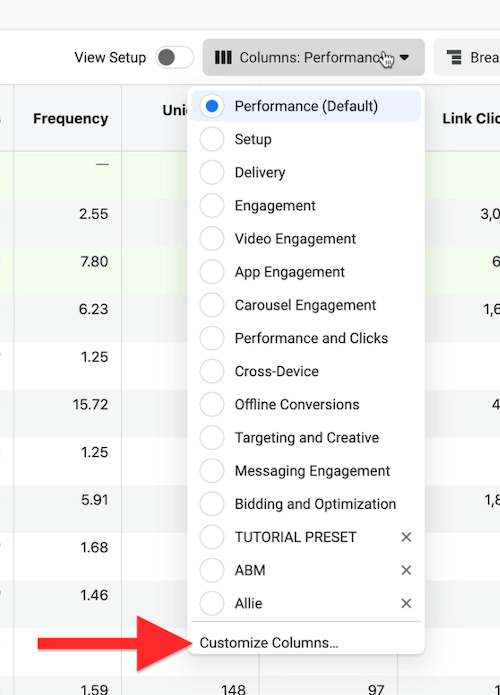
When you log into Facebook Ads Manager, you'll notice that the column layout is set to Performance by default. Many Facebook advertisers don't know that there are other layouts they can choose from such as Set Up, Delivery, Video Engagement, and Offline Conversions, among others.
I don't find any of these layouts to be great options. Instead, I suggest creating your own custom set of data so you can see the Facebook ad metrics you care about.
To set up a custom report, click the Performance drop-down menu and select Customize Columns.
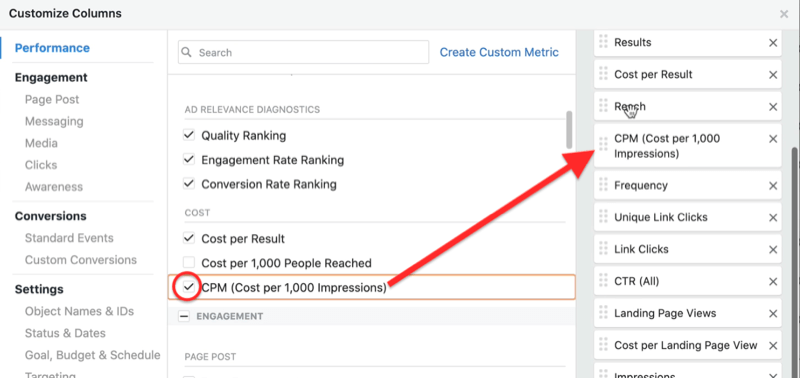
When the Customize Columns window opens, you'll see all of the columns for the Performance report layout on the right. Facebook lets you add, delete, or rearrange these columns so your Facebook ads data is organized the way you want.
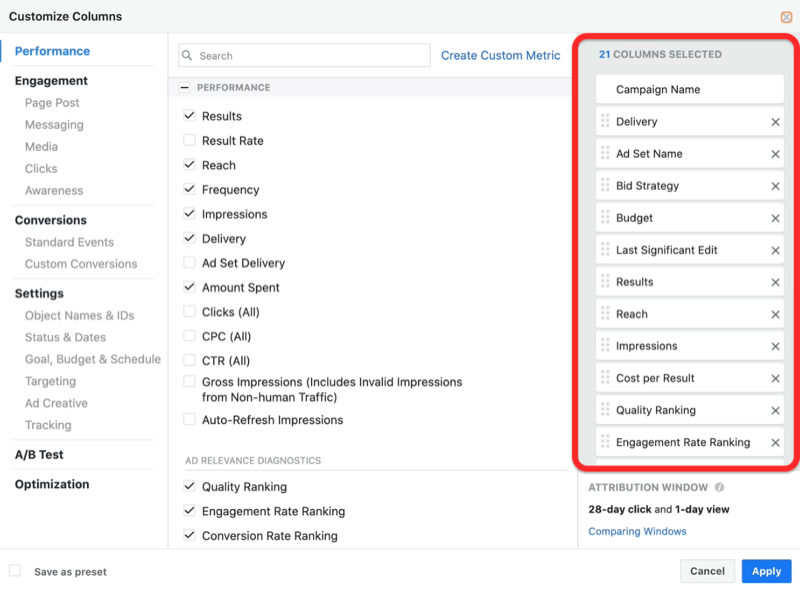
For example, you might choose to place your total number of clicks, cost per click, and click-through rate (CTR) next to each other in the report so you don't have to hop back and forth to see all of the data.
You'll want to go through these Facebook ad metrics one by one and customize the columns according to your preferences.
As an example, these are the columns I opted to delete from my custom report:
- Ad set name
- Bid strategy (I always use a similar budget strategy so I don't need this data in my report)
- Last significant edit
- Ends
- Schedule (If you don't set schedules for your ads—such as the days of the week or times of the day—you don't need this metric in your reporting.)
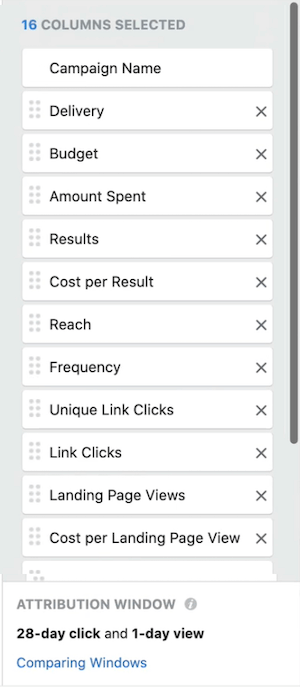
I then arranged the remaining 16 columns as follows:
Get World-Class Marketing Training — All Year Long!
Are you facing doubt, uncertainty, or overwhelm? The Social Media Marketing Society can help.
Each month, you’ll receive training from trusted marketing experts, covering everything from AI to organic social marketing. When you join, you’ll also get immediate access to:
- A library of 100+ marketing trainings
- A community of like-minded marketers
- Monthly online community meetups
- Relevant news and trends updates
- Campaign Name
- Delivery
- Budget
- Amount Spent
- Results
- Cost per Result
- Reach
- Frequency
- Unique Link Clicks
- Link Clicks
- Landing Page Views
- Cost per Landing Page View
- Impressions
- Quality Ranking
- Engagement Rate Ranking
- Conversion Rate Ranking
As you customize your own report, you'll likely remove a lot of the default options and then group the data in a way that makes the most sense to you.
#2: Add Engagement Data Columns to Your Custom Report in Facebook Ads Manager
The next step is to consider the data you want to add to your custom report. To add a metric, simply select the checkbox for that metric from the list in the middle of the window. Your chosen metric will then appear in the list of columns on the right.

Discover Proven Marketing Strategies and Tips
Want to go even deeper with your marketing? Check out the Social Media Marketing Podcast! Publishing weekly since 2012, the Social Media Marketing Podcast helps you navigate the constantly changing marketing jungle, with expert interviews from marketing pros.
But don’t let the name fool you. This show is about a lot more than just social media marketing. With over 600 episodes and millions of downloads each year, this show has been a trusted source for marketers for well over a decade.
Add all of the Facebook ad engagement metrics you want to track to your custom report. To find specific relevant metrics, you can either scroll through the list or use the search box at the top.
Here are the metrics I added to my custom report:
- CTR (All)
- Cost per Post Engagement
- Cost per ThruPlay
- Post Comments
- Post Shares
- Cost per Post Engagement (CPE)
- Video Plays at 25%, 50%, 75%, and 95%
- Video Average Play Time
- CTR (Link Click-Through Rate)
- CPC (Cost per Link Click)
Note that I added CTR (Link Click-Through Rate) because my CTR will be for all of the clicks, including someone clicking the Read More button to read the rest of my ad copy or clicking on my photo to get a better look. Just make sure you select the right CTR.
If you're using Messenger objectives, you'll also want to add New Messaging Connections, Cost per New Messaging Connection, and Cost per Messaging Conversations Started to your dashboard.
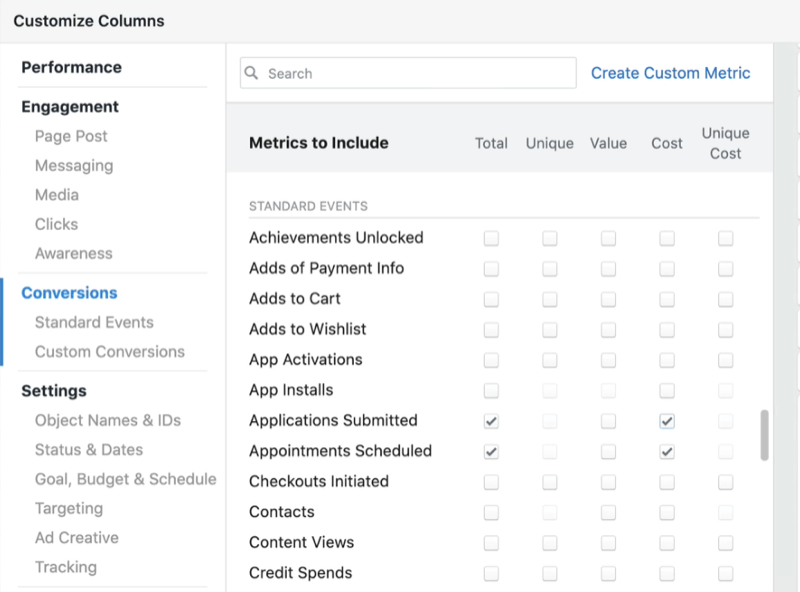
#3: Add Conversions Data Columns for Standard Events in Facebook Ads Manager
Next up is standard events, which is the most important group of Facebook ad metrics. Standard events help you understand what actions people are taking on your website. They're crucial to understanding your return on investment.
You'll probably add a lot of events to your custom report but the ones I use primarily are Registrations Completed, Applications Submitted, and Appointments Scheduled. I selected both the Total and Cost checkboxes for each of them.
To set up events, go to the Events Manager section in Facebook Business Manager. From here, you use the Event Setup tool. You just plug in your URL and decide what you want to track to install that event.
#4: Save and Edit Your Custom Report Layout in Facebook Ads Manager
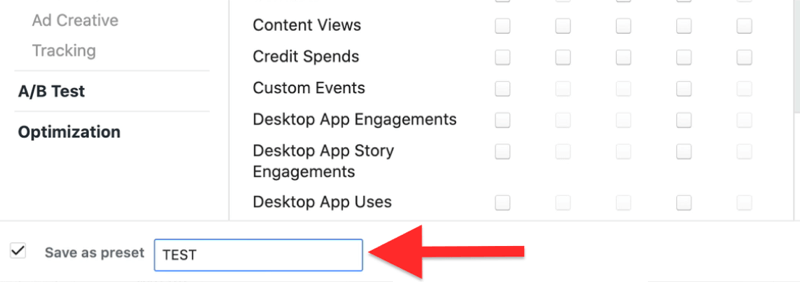
Once you've selected and arranged the columns you want to include in your Facebook custom report layout, the last step is to save your report.
In the lower-left corner of the window, select the Save as Preset checkbox and type in a name for your report. When you're done, click Apply to see your data in this new reporting view.
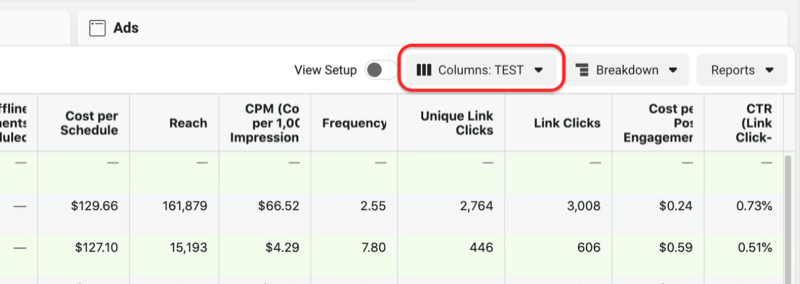
Now Ads Manager will show the Facebook data you want to see in the order in which you want see it. Under Columns, the name of your new dashboard will appear.
If you need to update your custom report in the future, go back to Customize Columns, make your changes, and click Save as Preset again to overwrite your original settings.
Conclusion
Many businesses that invest in Facebook advertising have no idea which ads are working and which aren't, or don't know how to track their return on investment. Creating a custom report layout in Ads Manager lets you focus on the Facebook ad data that matters most to your business.
It's also important that you install the appropriate events on key pages on your website. If those events don't exist, you won't be able to track anything from the past but you'll be able to track everything moving forward. That's critical to ensure you're spending money on the ads that work best.
What do you think? Are you inspired to create your own custom report layout in Facebook Ads Manager? Share your thoughts in the comments below.
More articles on Facebook ads:
- Find out how to adjust the grammar, copy length, and creative of your Facebook ads for better performance.
- Discover some of the biggest mistakes marketers make when managing their ads on Facebook and how to correct them.
- Learn how to budget your Facebook ad spend based on your revenue goal.
Attention Agency Owners, Brand Marketers, and Consultants

Introducing the Marketing Agency Show–our newest podcast designed to explore the struggles of agency marketers.
Join show host and agency owner, Brooke Sellas, as she interviews agency marketers and digs deep into their biggest challenges. Explore topics like navigating rough economic times, leveraging AI, service diversification, client acquisition, and much more.
Just pull up your favorite podcast app, search for Marketing Agency Show and start listening. Or click the button below for more information.
