 Is Facebook part of your marketing plan?
Wondering if Facebook ads are still worthwhile?
In this article, you'll discover stats from recent Facebook advertising research. You'll also find insights to help you make more informed choices for your advertising campaigns.
#1: Facebook Revenue & Growth Statistics
No one wants to invest in a platform that's in decline or losing its audience. One sign to predict the longevity of a platform is to look at revenue and growth statistics.
At the end of January 2018, Facebook released its fourth-quarter earnings, so you're getting the most up-to-date stats and forecasts below. Here are some stats to consider:
- Facebook's Q4 2017 revenue was roughly $13 billion with $1.44 diluted (adjusted for taxes) earnings per share (EPS) worldwide, with around half of the revenue coming from the U.S., and Europe in second place. GAAP revenue year-over-year change was 47%.
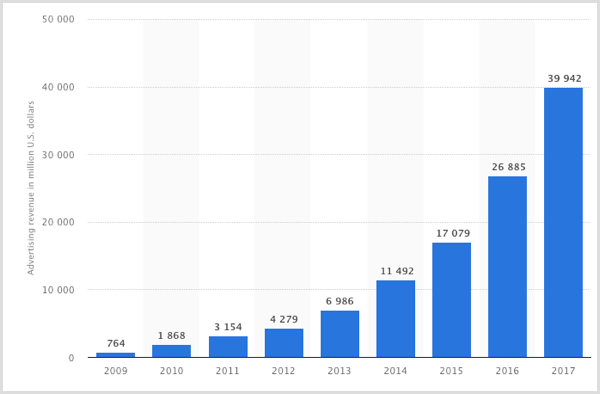
Below are two charts from Statista. The first shows Facebook's advertising revenue worldwide from 2009-2017:
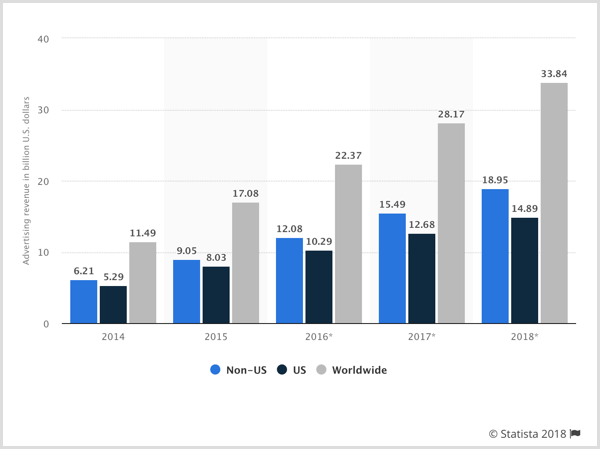
Take a look at Facebook's U.S. vs. non-U.S. advertising revenue growth to get a little more granular:
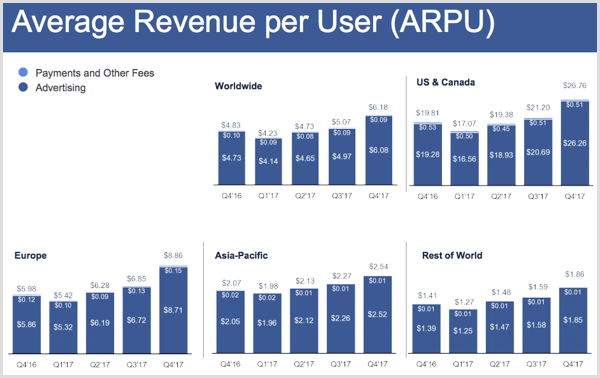
- In Facebook's Q4 2017 results, the average revenue per daily active user (ARPU) was at $6.18 worldwide, but it was $26.76 if we just look at the U.S. and Canada. This includes payments and other fees, but advertising takes up the bulk of it. To give perspective, daily active users were $1.37 billion on average for September 2017, an increase of 16% year over year.
So we know that Facebook is still making money and will probably be around for another year. But unless you're a shareholder, the details of this are pretty irrelevant in your day-to-day advertising efforts.
- Checking to see if eMarketer's predictions were on point, the pace of growth for Facebook's ad revenue was supposed to be markedly lower by 2018 (26.5%) than it was in 2016 (57.4%). Advertising revenue was $12.8 billion for Q4, up from $10.1 billion in Q3 – and again, we see the U.S. take the lead on this one.
For now, the trend is upward for advertising growth. Also, due in part to Facebook news feed changes that shift organic publishers to a more pay-to-play mindset, we might see advertising costs rise in 2018.
Yikes, more competition for ad space. I know, I know. And how are we seeing mobile vs. desktop advertising revenue?
Get World-Class Marketing Training — All Year Long!
Are you facing doubt, uncertainty, or overwhelm? The Social Media Marketing Society can help.
Each month, you’ll receive training from trusted marketing experts, covering everything from AI to organic social marketing. When you join, you’ll also get immediate access to:
- A library of 100+ marketing trainings
- A community of like-minded marketers
- Monthly online community meetups
- Relevant news and trends updates
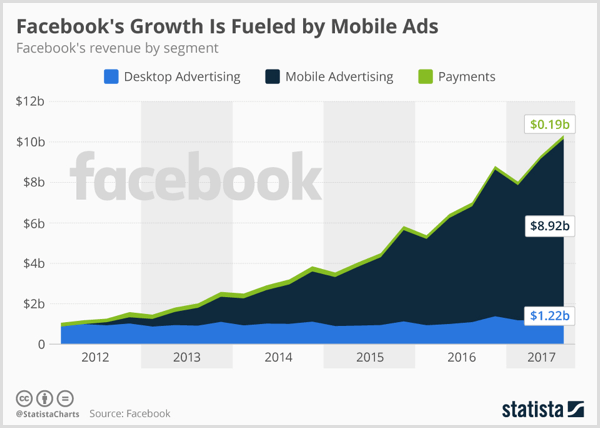
- Mobile advertising represented approximately 89% of advertising revenue for the fourth quarter, up from 84% of ad revenue for the same quarter in 2016 and up slightly from 88% in Q3.
This chart from Statista shows how Facebook's growth has been fueled by mobile ads.
Considerations for Application
At first glance, one might come to the conclusion that Facebook is earning money and continuing to grow, and its main source of revenue is from advertisers. No doubt your competitors are advertising there, so why shouldn't you? Obviously, people are clicking on these ads, looking at the revenue for daily active users (since users don't pay for membership) so they'll engage with yours as well, right? Not exactly.
First, although paid ads are the primary source of revenue for Facebook, it does have a few other avenues it taps into (e.g., Facebook Live, games/apps, and soon payoffs on investments in emerging technologies). Also, when you see general statistics like those above, they aren't broken down enough to tell you which industries and types of businesses, and types of campaigns actually do well.
For instance, Facebook can be viewed more like the Google Display Network than the Search Network as far as the temperature of the traffic you'll most likely get from the platform. That's not to say that direct response ads won't perform well on Facebook, but to determine whether it's the best platform for your ads, you'll want to look at your core offer and the intent of your audience.
But even so, check out that growth in mobile ad revenue. We've read time and time again how mobile is the future, and how all of your landing pages and websites should be mobile-optimized.
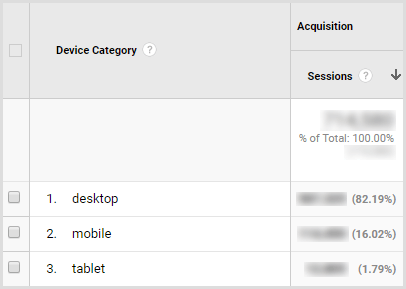
It's not to say that considering mobile won't help your campaigns at all, but you'll want to check your analytics to be sure your site actually gets most of its traffic from mobile, not desktop, before you go all in. In the case below, optimizing for how a desktop user engages would take precedence over optimizing for mobile users.
There are some types of businesses that benefit more from a mobile ad focus than others. To illustrate, if you're a local business, you may want to target people on their phones if their GPS shows that they're within a certain distance from your physical business location. After all, we aren't carrying our desktop computers with us when we're out and about.
Think about what people are doing and where they are when they're engaging on mobile. What types of offers are most likely to appeal to them during that time – and is your offer optimized for the state of mind users will be in?
Maybe you find a mix of mobile and desktop ads serves you well. Just be cautious about making mobile the end-all-be-all for your campaign success.
#2: Facebook Market Share Stats
Even if Facebook ads perform well in a silo, you want to consider all options for advertising channels you might have in a marketing mix. You have a limited budget and need to make sure you're spending it wisely.
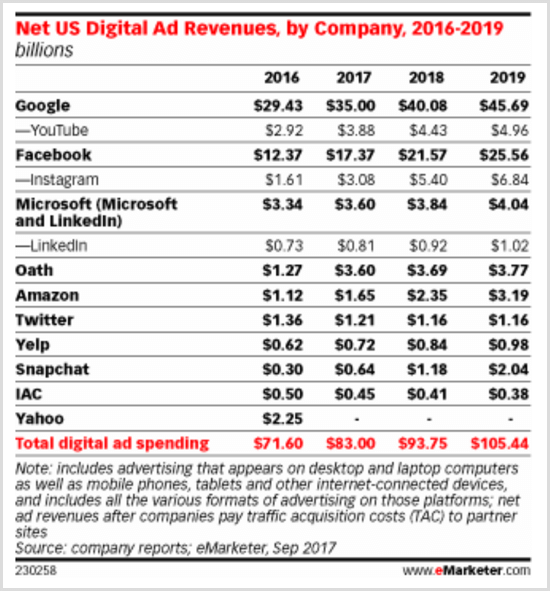
So let's consider where Facebook stands when stacked up against other advertising platforms, which could very well be contenders. This chart from eMarketer shows that 2017 will be the first year Facebook holds more than one in five U.S. digital ad dollars.
But let's not put all your eggs in one basket yet…
- Comparing the revenues previously mentioned with competitors in the market, the company's total digital revenues in the U.S. will grow 40.4% to $17.37 billion (a share of 20.9%). Yes, sounds good, but again, hang tight…
- With $15.28 billion in mobile ad revenues this previous year, this gives 26.8% for Facebook's share of the U.S. mobile ad market. Still looking good…
- Facebook is the sixth most valuable public company in the world according to Forbes' Global 2,000 in May 2017. Its current market value is around $519 billion.
All right, that's perhaps a subjective opinion in saying it's the “sixth most valuable.” Some might define value differently. And yes, as impressive as all that sounds, there's still more to consider.
Considerations for Application
The first thing I notice with many of these stats is they're about the U.S. market. Keep in mind these stats may not be as beneficial if you don't know where your particular audience is located. Do you primarily get traffic, conversions, or sales from the U.S.? Just because your brand is located in the U.S. doesn't mean that your audience is.
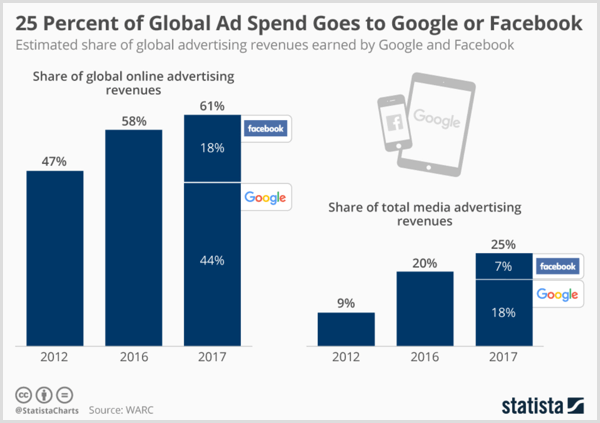
If you're more global or have an audience primarily outside the U.S., you're going to want to evaluate statistics for those regions and countries. Even a global chart like the one below from Statista wouldn't break it down enough for proper targeting, mainly because it speaks to ad spend rather than advertiser ROI.
Also, even if your audience is in the U.S., I don't know how many times I've seen brands target all of the U.S. with one campaign. If you really want to see your campaigns perform well at a lower cost per click or even lower cost per conversion, you want to get pretty specific with the way you layer targeting.
Facebook allows you to narrow geographic targeting so that even within the U.S., you might find you get more business in a particular state or city. Even if you get decent performance in several areas, there might be some offers or ad copy variations that appeal more to those in a particular geographic area.
For example, maybe your ad will see good performance from being more geographically targeted by zip codes rather than by state.
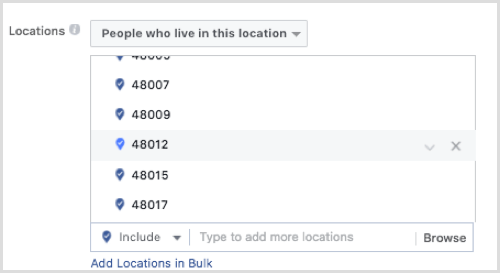
Another way to drill down is with advertising by device.
Did you know China is one of the largest contributors to global advertising growth, specifically with regard to mobile? Total ad spend will climb 14.7% in China this year to $84.54 billion. Arguing that granularity in our statistics makes them more relevant to your particular business or audience is also an argument for not ignoring how you operate in the bigger scope of the advertising space.
And let's say that after our initial discussion of mobile advertising, you still determine advertising for mobile is for you. We know from the previous statistics that advertisers on Facebook are taking advantage of mobile ads, but is Facebook necessarily the right platform for mobile ads?
Per the Marketing Charts image below, it may be that spending to advertise on audio platforms, if targeting mobile users, pays off more for your brand in 2018.
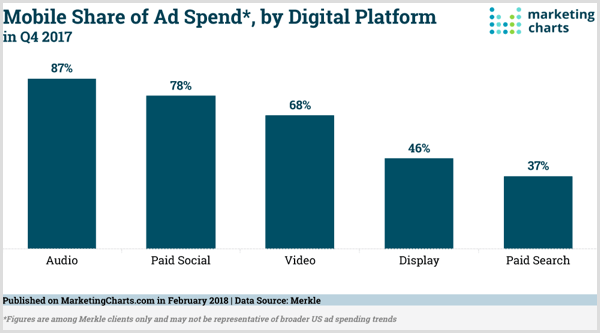
Bigger picture: While mobile accounted for a high percentage of ad revenue on Facebook itself, we see that it's well below half when compared with the U.S. mobile ad market as a whole. So what are your other options for mobile advertising? Let's move on.
#3: Instagram Ad Data
Even though Instagram is a separate platform in terms of audience and how users engage, we shouldn't forget that Instagram is owned by Facebook. What now becomes an important question with any Facebook stats moving forward: Does this include or exclude Instagram?
You can run ads on Instagram through Facebook Ads Manager, so in a discussion of Facebook ads, it's important to at least briefly cover Instagram ads. You might be surprised that sometimes Facebook lead ads for mobile actually outperform those that run on Instagram. Here are some Instagram ad stats to compare with ones we mentioned for Facebook:
- There are more than 2 million monthly advertisers on Instagram.
- Instagram's mobile revenue has grown 90.7% year over year to reach $3.08 billion in 2017. Instagram is expected to generate almost $6.84 billion in mobile advertising sales for 2018. By 2019, it's projected that ad revenue could reach over $10 billion.
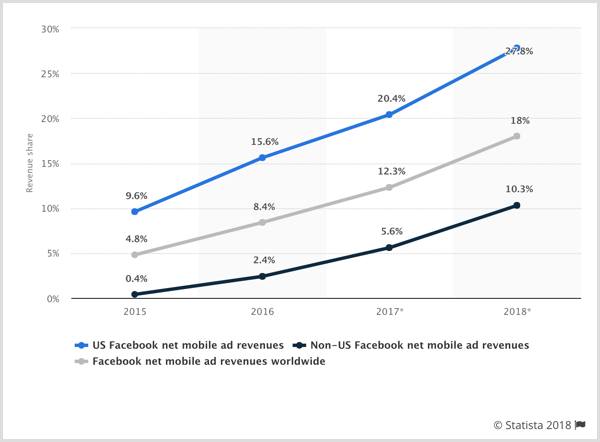
- In 2018, Statista's chart below shows that Instagram is projected to account for 27.8% of Facebook's net mobile advertising revenues in the U.S. and for 18% of global mobile ad revenues.
Considerations for Application
Facebook isn't the only platform to consider for running mobile ads. After all, Instagram is a mobile-engaged platform. Still, we see that its mobile ad market reach is still pretty small. Even though it covers a good chunk of Facebook's mobile ad revenue, it's still below half. That being said, with substantial growth year over year, it may start taking more of the pie.
So far, we've covered stats about advertising spend and how that's allocated across devices or platforms, but what about audience considerations?
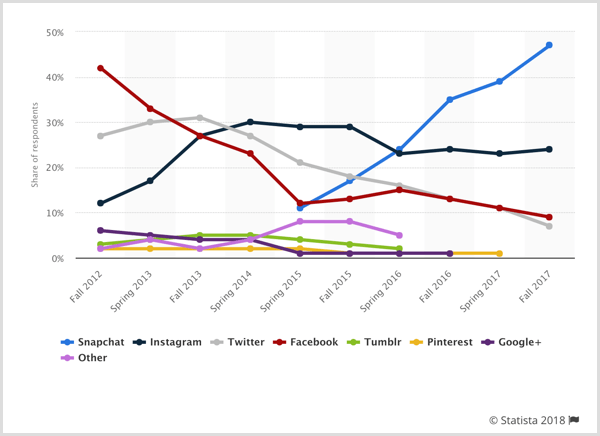
One might be quick to jump on the bandwagon to advertise on Instagram if targeting teens, since the Statista chart above shows Instagram as second to Snapchat in teen usage. But again, this isn't specific enough. Ask these questions to decide if Instagram ads are right for you:
- How many teenagers engage with ads specifically, as opposed to organic content?
- What types of ads or content within ads are teens most often engaging with?
- How are teens engaging? Are they actually purchasing after viewing an ad?
Now we have taken this stat beyond the surface-level assumptions and gotten a more well-rounded view of where to gear advertising efforts for teens.

Discover Proven Marketing Strategies and Tips
Want to go even deeper with your marketing? Check out the Social Media Marketing Podcast! Publishing weekly since 2012, the Social Media Marketing Podcast helps you navigate the constantly changing marketing jungle, with expert interviews from marketing pros.
But don’t let the name fool you. This show is about a lot more than just social media marketing. With over 600 episodes and millions of downloads each year, this show has been a trusted source for marketers for well over a decade.
#4: Facebook User & Advertiser Insights
Now it's time to look at your audience and competition (or in some cases, those who might become co-partners in Facebook advertising efforts). When we say a platform has 2 million monthly advertisers, is that necessarily a good thing? There are two ways to look at that stat.
First, more brands advertise on Facebook because it's an effective platform that brings ROI. Second, even if #1 is correct, that's a lot of ads to compete with and you become a small fish in a big pond (unless your product/service is super-awesome and you're able to convey that in a way that blows the other fish out of the water).
So, let's take a look at some helpful Facebook stats in this area:
- Visualized in the Statista chart below, Facebook announced that six million active advertisers were using the platform to promote their products and services.
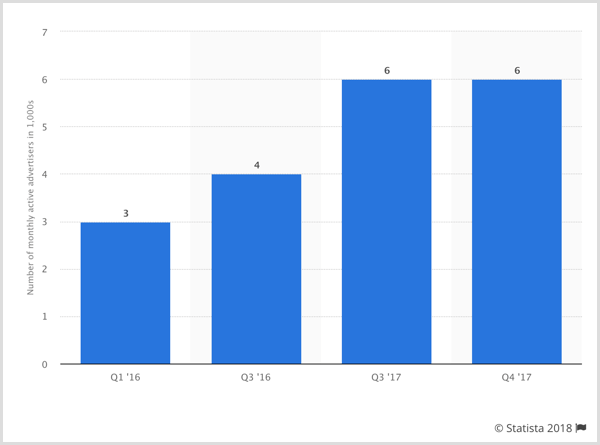
But again, that doesn't mean they're advertising to your audience, so I wouldn't let that number scare you off.
- In an October 2017 survey taken by U.S. small business owners, 24% of respondents thought that social media was very important to connect with customers. This means even though there are some big players on the network, small businesses still believe it's beneficial.
- Facebook is the most popular platform for marketers to advertise on (91%), followed by Twitter (34%). So if you find that the competition is fierce, you could look into other avenues. It's correlation, not always causation, when we equate popularity to ROI.
Now let's take a look at another stat…
- 78% of advertisers are satisfied with their Facebook ads.
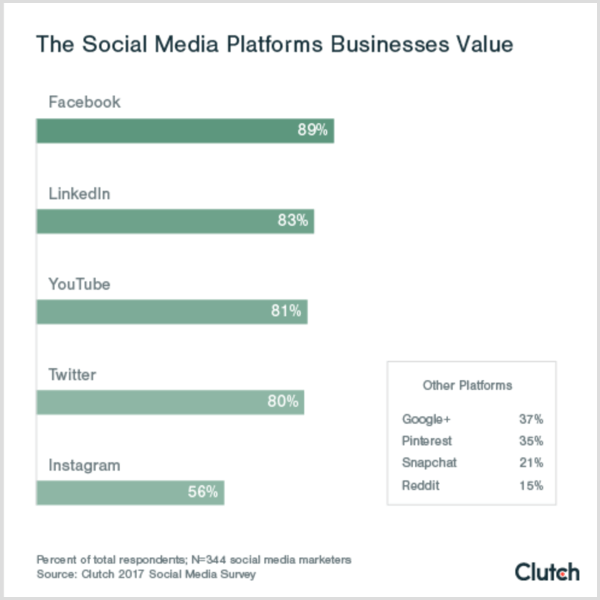
Again, satisfied in what way? We only can assume it's due to results, and what each business considers to be satisfying is subjective. Plus, we also want to break down popularity by business type (B2B vs. B2C). Below is a chart from Clutch that helps us do that:
- B2C marketers (45%) were more likely to agree that their Facebook marketing was working compared to B2B marketers at 37%, according to the 2017 Social Media Marketing Industry Report.
We should take the sampling with a grain of salt as far as being representative of the whole. It depends on who was surveyed and when, but we might speculate that LinkedIn is still preferred by a good many B2B marketers.
- 64% of social marketers plan on increasing their Facebook ad activities, according to the Social Media Marketing Industry Report.
It's always good to look at not only current stats, but also projections. The waters may not seem deep now, but they may become deeper in the near future. Timing can be everything when it comes to beating out the competition for ad space. Get in front of your audience while you can.
But all is not lost. You might be surprised to know that out of the 65 million active businesses on the network, only 5 million are advertising each month.
But you're not home-free yet. Did you know that Facebook pays influencers, publishers, and celebrities to promote Facebook content? This chart from Forbes breaks down average pricing for influencers.
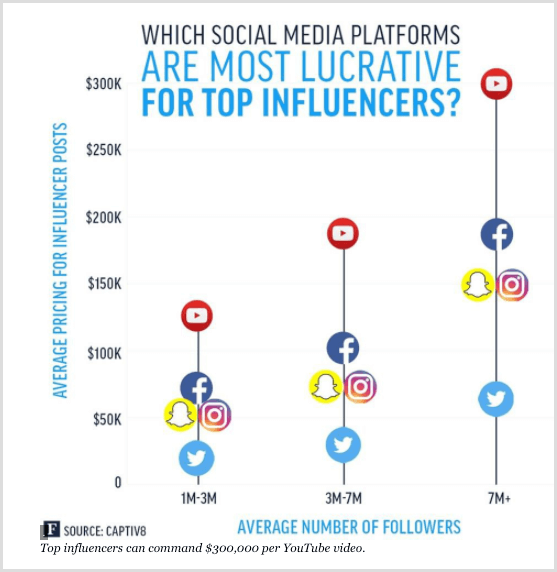
So it's not just the businesses vying for audience attention. And who makes up this audience? Below, Statista has a breakdown of the global distribution of users by age and gender:
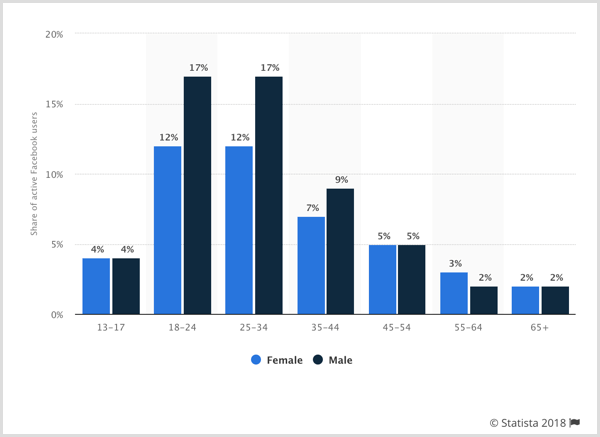
Facebook reports that only 239K monthly users are from the U.S. and Canada, which seems like a small number compared with other areas (almost 89% come from outside the U.S.).
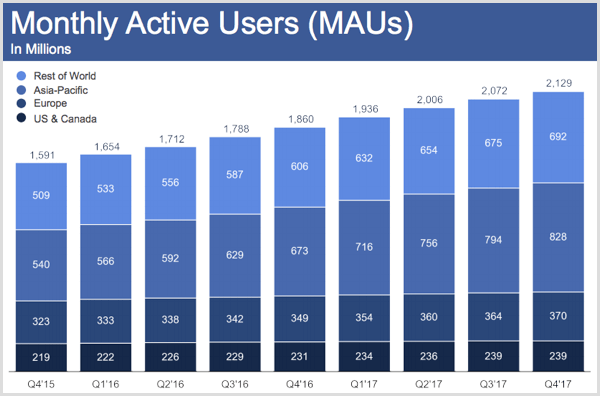
However, when we look at the revenue gained from these users, the data tells a different story.
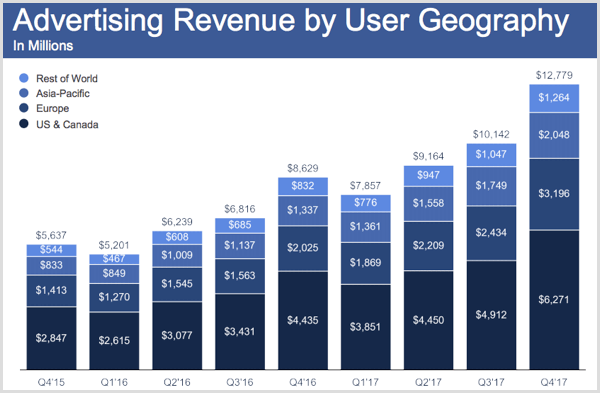
Considerations for Application
A common line of thought is if everyone else is doing it, you should as well. But where there's lots of advertisers and competition for ad space, the costs tend to go up. Unless your audience is primarily on Facebook, perhaps you want to go where there's less competition.
Keep in mind that some stats speak to how much is spent from a region as a whole, while others speak to how many businesses in a particular area are spending that amount. It makes a difference if a few businesses are spending a bucketload versus many businesses spending only a little. So the question remains, are these marketers outside the U.S. spending less to get the same results?
Not to say that you should shift your focus based on that, but when you read the stats, think about what data is missing that would give you a more complete picture. In this case, another question I might wonder is, out of those businesses, how many would actually be competitors of my brand? For instance, these stats don't show how many out of these areas are in my industry or targeting my specific audience.
#5: Facebook Content & Engagement Numbers
Why recreate the wheel when others' performance can help you determine what works as far as content? Well, I'll get to that in a bit. For now, let me at least give those of you just starting out with Facebook advertising a baseline of content you can try with the hopes of increasing your odds of success.
- Images account for 75%-90% of Facebook advertising effectivity or performance.
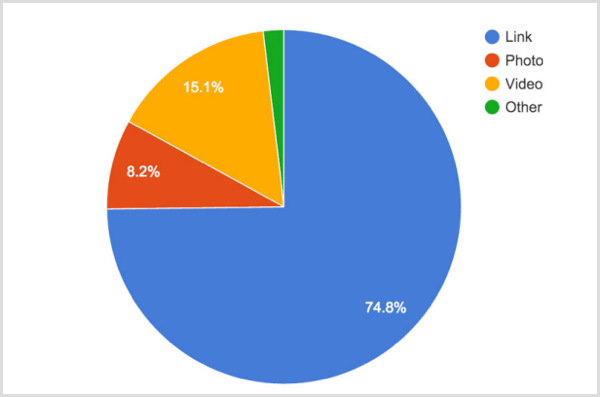
- Facebook is projected to generate $9.58 billion (USD) in video ad revenues in 2021, up from an estimated $674 million (USD) in 2015. That being said, link ads still tend to be more popular, as you can see in the Smart Insights graphic below.
- The most effective length of an ad title is four words, and 15 words for a link description.
But where should you be running ads: news feed, side, or perhaps Messenger?
- 33% of customers want to make or confirm a purchase in Facebook Messenger, so utilizing Facebook ads in Messenger is worth considering.
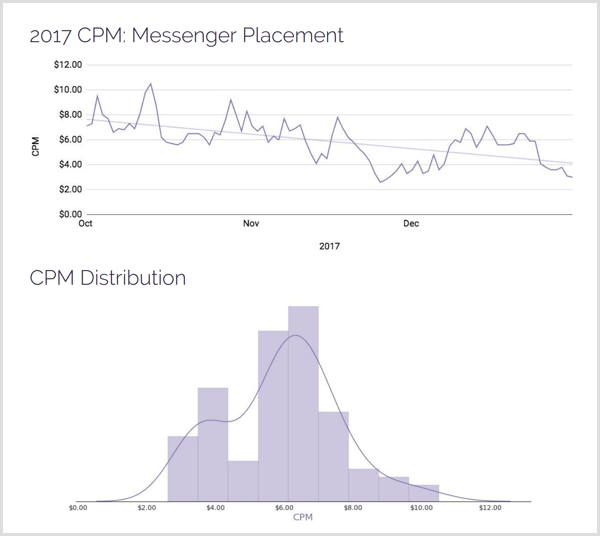
Keep in mind, however, that Messenger ad click-through rates (CTRs) decreased overall during Q4 after a period of increases in October and November, ending the year at an average of 1.35%. The chart below, from AdStage, visualizes this well. More on average click-throughs later in this article.
- 26% of Facebook users who clicked on ads reported making a purchase, so they aren't just driving engagement and clicks.
Consideration for Application
Let's look at the last of those stats: of those who clicked and made a purchase. The rate of 26% could be considered high or low depending on several factors. Because users clicked on ads, that shows some initial interest. The problem may lie on the conversion-rate optimization (CRO) side with the landing pages either not matching the offer or landing pages not providing enough information of value for the user to make that final decision.
Also, this stat says “purchase,” but that doesn't necessarily mean the user didn't convert or provide some form of lead identifier such as an email address. If that's the case, the issue may be more on the sales side. Maybe the sales team didn't follow up in a timely manner.
Given the vagueness of these stats, it's good to have varied types of content and ads to test before determining whether your ads work. General effectiveness doesn't mean brand effectiveness. Also, performance depends on the goal. Link ads may be best for generating website clicks, and video ads may be good for showcasing a product or getting more engagement on Facebook. If I'm not shooting for a purchase, I likely won't get one.
It's interesting that a May 2017 survey shows 25% of respondents were annoyed with Facebook advertising, while 11% reported the opposite. During that survey period, 10% of consumers also expressed that Facebook advertising was helpful, while 26% said the opposite.
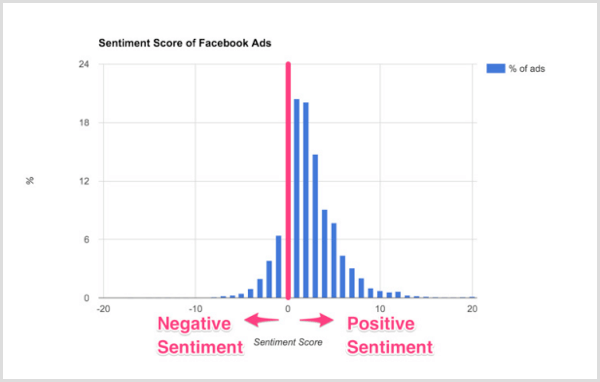
If there's a general annoyance, I suppose it wouldn't matter what content or type you put out, although these particular individuals surveyed may have just had poor experiences or weren't targeted with the right offer at the right time. I also wonder at the fact that these stats don't add up to 100%, so what does the majority feel? Smart Insights' sentiment analysis of 111,800 ads seems almost split down the middle.
#6: Facebook Ad Cost & Performance Metrics
Certain industries or types of businesses tend to have higher costs for their ads than others. There are numerous factors that contribute to this that go beyond the scope of this aticle, but I wanted to give you at least some idea. Here are the most recent stats I found:
- If you want email addresses, Facebook has many advertisers reporting costs below $1 per lead.
- Depending on the source you read (Sprout Social, Aggregate blog, or AdStage), the average CPC and CTRs vary. Since AdStage's chart was from Q4 2017, it seemed the most up to date though, with Facebook ads' average CPM at $12.45, average CPC at $0.54, and average CTR at 2.34%. This is a 37% increase in CPM, 14% increase in CPC, and 25% increase in CTR compared to Q3.

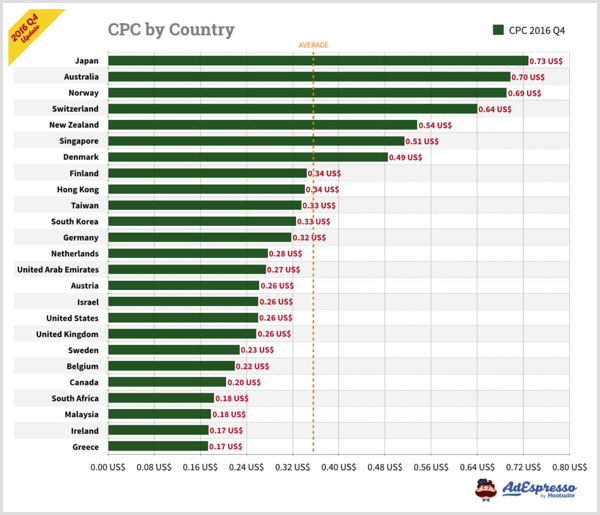
Although dated, I took a look at some averages for country, age, and industry. AdEspresso shows that Japan is coming in pretty expensive, while Greece and Ireland are much cheaper.
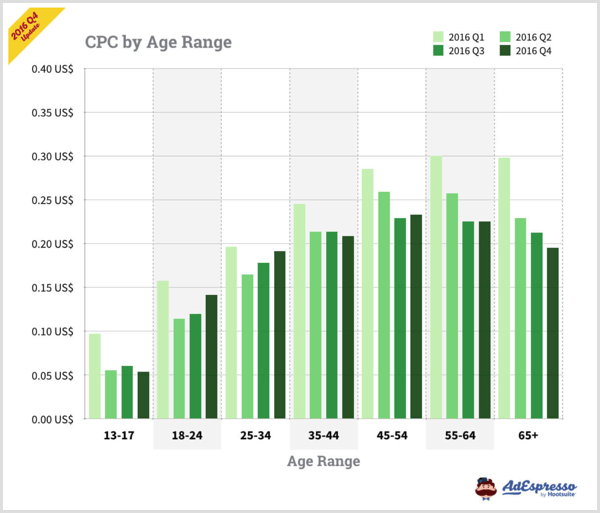
It seems to be more expensive to advertise to the older age groups.
WordStream has a chart that shows the finance and insurance industry had the highest CPC, while the apparel industry had the lowest. The legal industry had the highest CTR, while the employment and job training industry had the lowest.
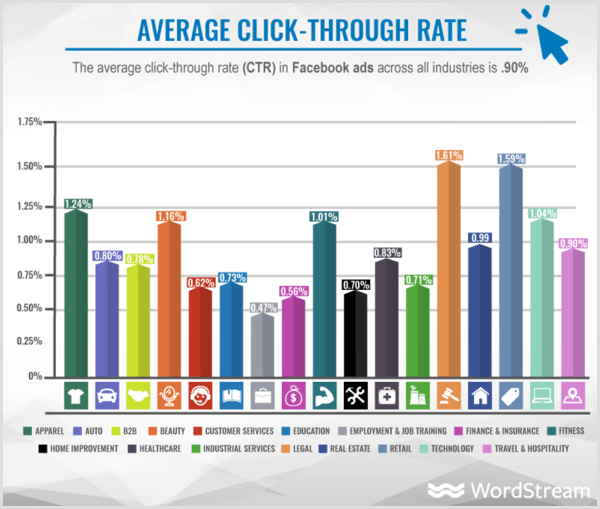
Depending on what audience you're targeting and industry you're in, it may behoove you to advertise on Facebook. Keep in mind that you're still not comparing with other advertising channels here.
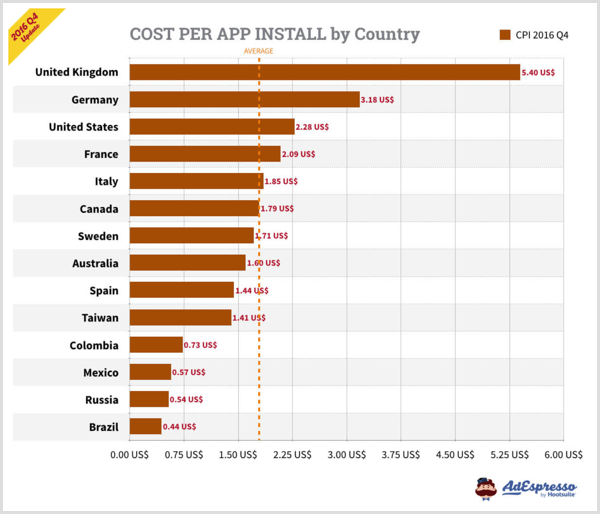
A lot of stats on mobile vs. desktop are rather dated, with many sources throughout the web referencing AdEspresso's Q3 2016 costs. But it's what we've got, so let's look at this chart from AdEspresso that shows cost per app install by placement:
Finally, let's not forget an Instagram cost assessment:
- The average CPM for Instagram ads increased 35% to $10.14, the average CPC increased 80% to $2.62, and the average CTR increased 33% to 0.39%.
Considerations for Application
Here we come to the meat of it all. It's great if your audience is on Facebook and they're engaging with offers similar to yours. But you have a hard-lined budget and want to make sure that Facebook ads are going to bring a good ROI. You might want to compare largest CPC on Facebook to other platforms your audience is actively engaged on.
More importantly, compare cost per conversion/sale on Facebook to other platforms your audience is actively engaged on because it does no good to get low-quality traffic that doesn't convert. If you're in one of the industries mentioned above, take note of the CPC and CTR, but again, remember that conversions are what really matter.
The one thing that stats can do is confirm or deny some baseline assumptions you may have. As an example, there are a lot of people who think apparel or ecommerce performs better on platforms like Pinterest; yet there seems to be a lower CPC for the apparel industry. Now if that traffic actually converts, that could be good ROI.
But at the end of the day, stats and averages don't reflect how your business will perform. The only true way to figure that out is to test. If we were to say that XYZ industry sees 20% of the results, but your brand campaigns are bringing in 15% of those results, it might be better than XYZ industry sees 22% of the results, but your brand campaigns are only bringing in 0.2% of those results. It's all relative.
Wrap Up
My goal with this post wasn't to bombard you with Facebook ad stats, but to show you how you can be a critical thinker when you look at these or other stats moving forward. You can turn the data being relayed into information you can actually apply to your campaigns.
What do you think? Are the data and discussion above helpful? How will you use them to adjust your Facebook advertising? Share your thoughts and questions in the comments below.
Attention Agency Owners, Brand Marketers, and Consultants

Introducing the Marketing Agency Show–our newest podcast designed to explore the struggles of agency marketers.
Join show host and agency owner, Brooke Sellas, as she interviews agency marketers and digs deep into their biggest challenges. Explore topics like navigating rough economic times, leveraging AI, service diversification, client acquisition, and much more.
Just pull up your favorite podcast app, search for Marketing Agency Show and start listening. Or click the button below for more information.

