Is your organic Instagram content working? Wondering how to access the analytics data you need without paying for expensive third-party tools?
In this article, you'll learn how to use the Instagram Insights feature to analyze seven different types of Instagram content. You'll also discover how to tell whether your content is attracting your ideal audience.
Why Use Instagram Insights for Marketing?
In 2021, there are over 1.074 billion Instagram users worldwide.
It's no wonder 71% of U.S. businesses are already using Instagram. But the most successful ones aren't throwing photos and videos into the void without a plan and hoping to get results. They have a strategy.
This is where analytical data plays a crucial role. If you know your predominant audience demographic—including what time of day your users are most active and which types of content they like to consume—you have all the ingredients you need to build an Instagram business presence that's designed for success.
If you're an Instagram user with a business account, you have access to free analytical data about your audience and content performance directly in the app: Instagram Insights—a native Instagram business tool that has access to your posts and data.
Note: If you have a personal Instagram account, you'll need to upgrade to a business account to take advantage of Insights. Instagram will only show you analytics for the content that was published after you switched your personal account to a business profile.
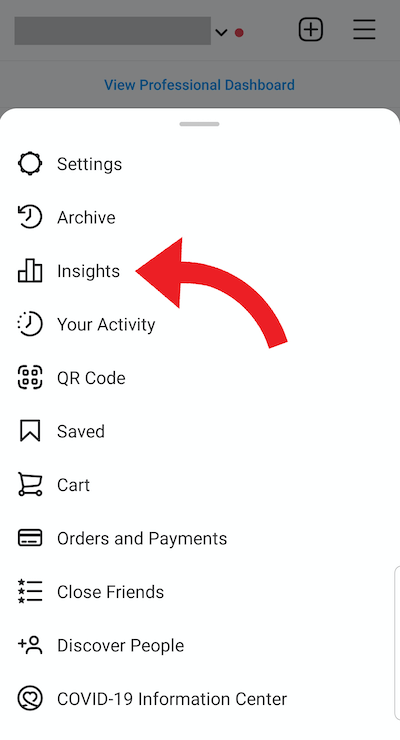
Instagram Insights can be accessed on your business profile by tapping on the three lines in the top-right corner. You can also access your Instagram analytics through your professional dashboard.
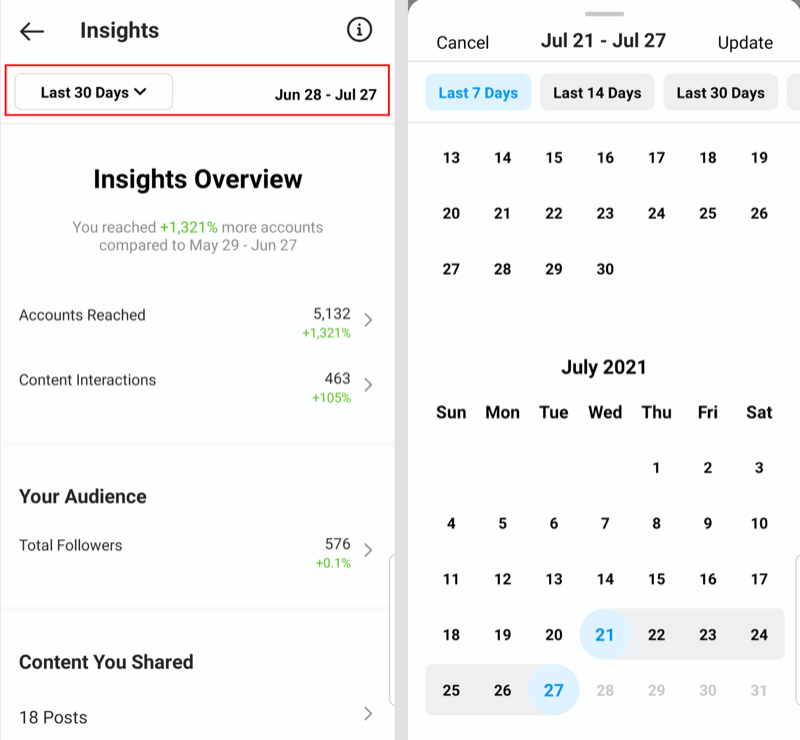
Inside Instagram Insights, you'll see a basic overview of your audience and content performance.
At the top of the screen, you can select the date range to be displayed and access Instagram's new calendar tool to customize it in a way that wasn't available before. Instagram recently doubled the timeframe from 30 to 60 days and announced that the range will be increased to 90 days in late summer 2021.
Now we'll look at how to delve into your analytics for different types of Instagram content.
Get World-Class Marketing Training — All Year Long!
Are you facing doubt, uncertainty, or overwhelm? The Social Media Marketing Society can help.
Each month, you’ll receive training from trusted marketing experts, covering everything from AI to organic social marketing. When you join, you’ll also get immediate access to:
- A library of 100+ marketing trainings
- A community of like-minded marketers
- Monthly online community meetups
- Relevant news and trends updates
#1: Instagram Insights for Feed Posts
Instagram Insights provides a valuable look at how your feed posts have performed in terms of audience engagement and discovery.
In your Insights Overview, scroll down to the Content You Shared section, where you'll find your posts as the first option.
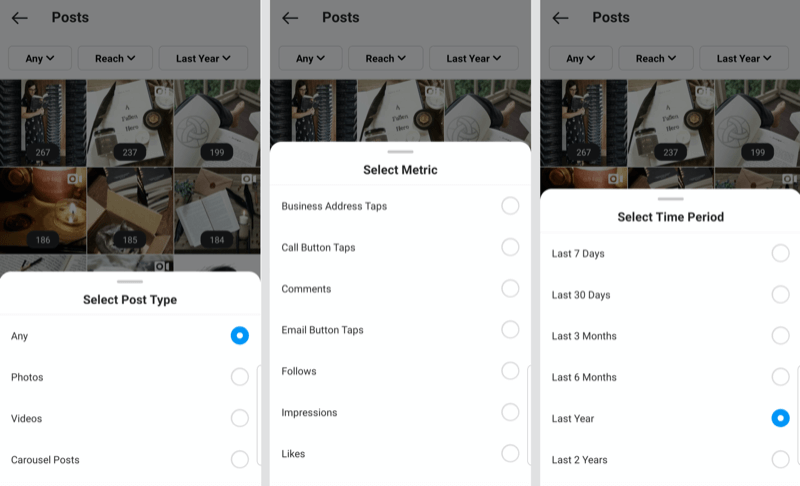
Inside Posts, Instagram will automatically sort your content based on performance so you can quickly see which posts had the most engagement from your audience.
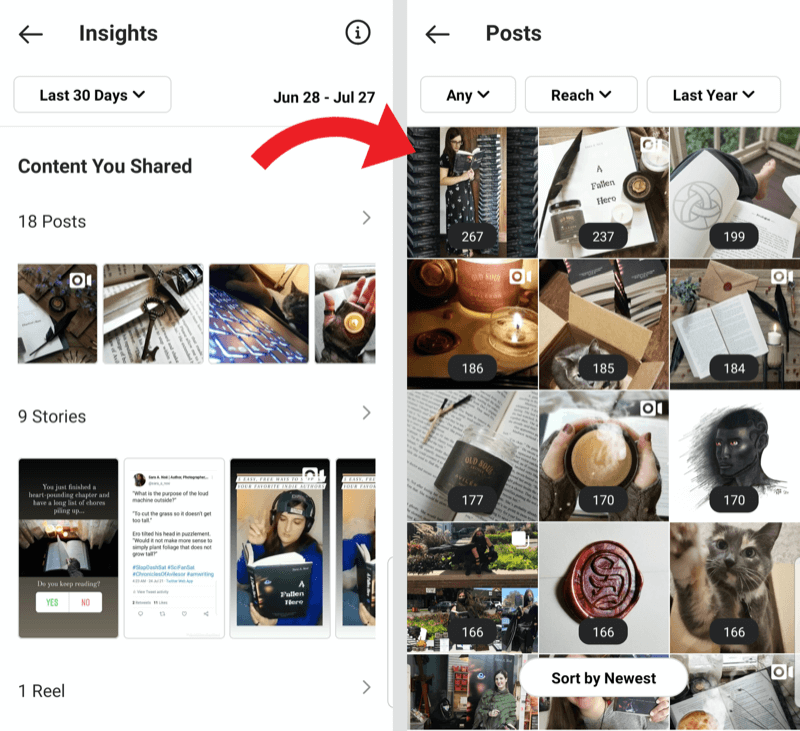
By default, Instagram will show you all types of feed posts, including photos, videos, and carousel posts.
You can restrict the data by specifying which type of post you want displayed, which metrics you want to examine, and what timeframe to focus on. These settings allow you to see a broad overview but also tailor your results to fit the specific Instagram key performance indicators (KPIs) you need for your content strategy.
In addition to the broad post overview available in Instagram Insights, you can also see the analytics on individual posts by selecting a post and then tapping View Insights.
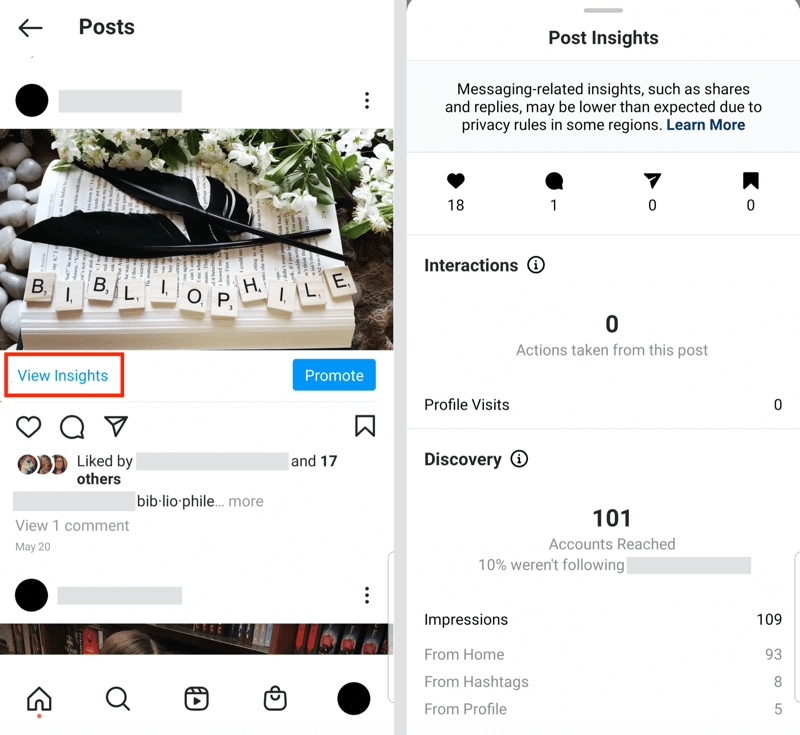
Looking at individual post insights will show you the total likes, comments, shares, saves, interactions, profile visits, accounts reached, follows, and impressions from home, hashtags, and profile.
Instagram KPIs for feed posts:
- Engagement: Instagram's algorithm is largely dependent on post engagement. Simply put, if people aren't engaging with your posts, your content isn't going to show up in feeds. Pay close attention to the posts with the highest engagement and see how they can be used as a model for future posts. Don't despair if you have a low percentage—the average Instagram engagement rate across all industries in 2020 was only 1.22%.
- Impressions From Home: This data means that your followers saw your post in their feed. Ideally, all of your followers would see every single one of your posts but that isn't the case. If this number is high (even better, if it's close to your follower count), that's a good sign. It means most of the people who follow you see your content in their feed and react to it.
- Hashtags: A high number of impressions via hashtags on Instagram indicates your hashtag strategy is on point, whereas a low number shows that you might want to do some research to find more relevant hashtags. See what hashtags your competitors are using and go from there.
#2: Instagram Insights for Stories
Instagram stories for business have the potential to reach a wide range of people, especially considering that 500+ million users are on Instagram Stories every day. Instagram itself reports that one-third of the most-viewed stories come from businesses.
You can access Instagram analytics for your stories in the same way as feed posts. From your Insights Overview, scroll down to Content You Shared and find stories below your feed posts.
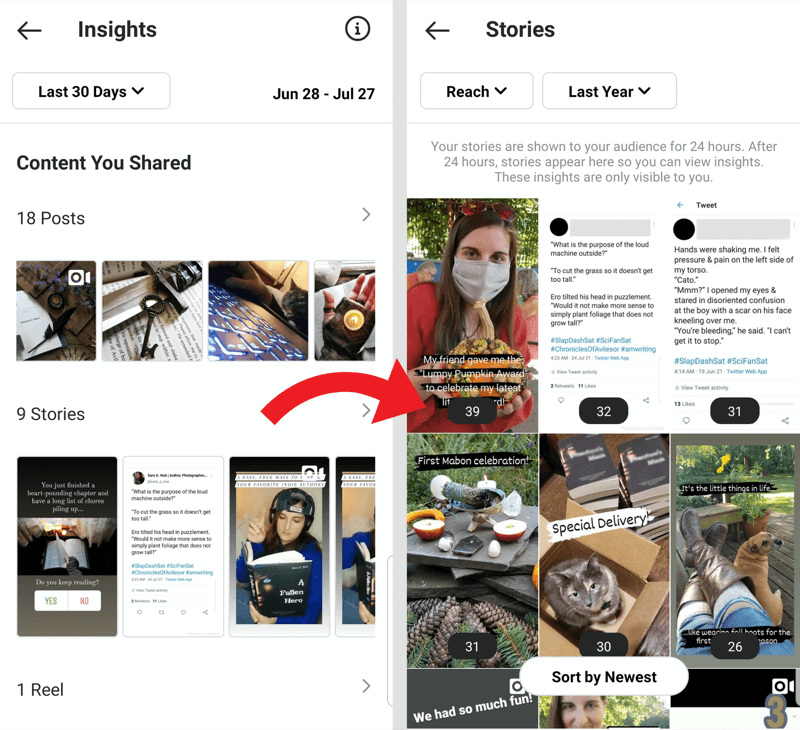
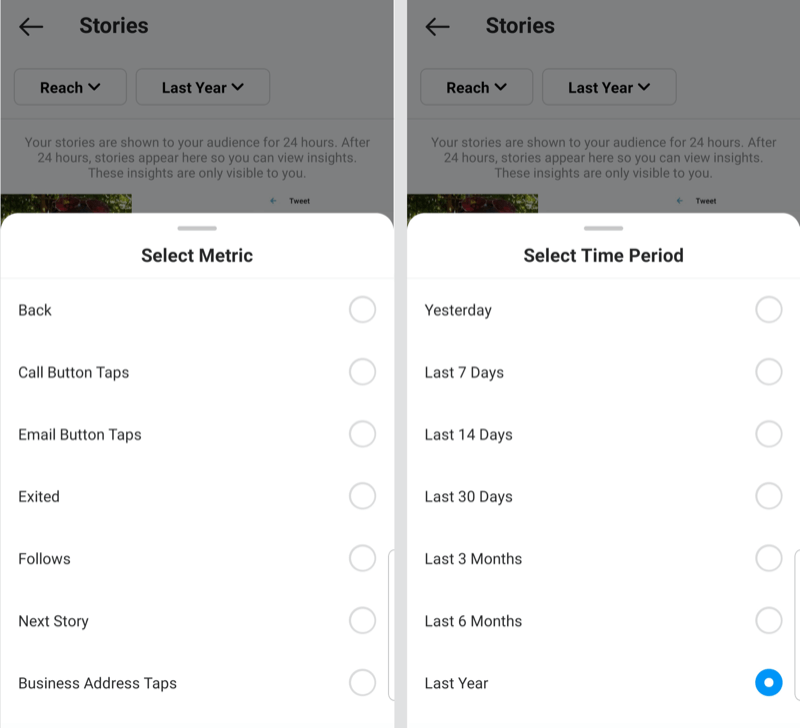
Instagram Insights will sort your stories based on the highest-performing content. For a more selective analysis of your content, you can customize your results based on a specific date range and/or story metrics such as back clicks, call button taps, email button taps, exited, follows, next story, and business address taps.
You can also view insights on an active story by opening it and either swiping up or tapping on the “Seen by #” in the bottom-left corner.
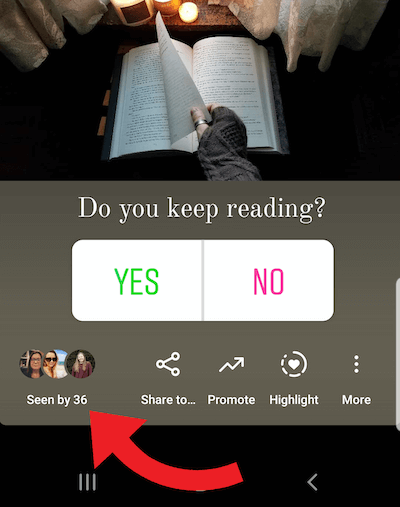
This will display discovery and impression insights. If the story was interactive, such as a poll, you can also view those results.
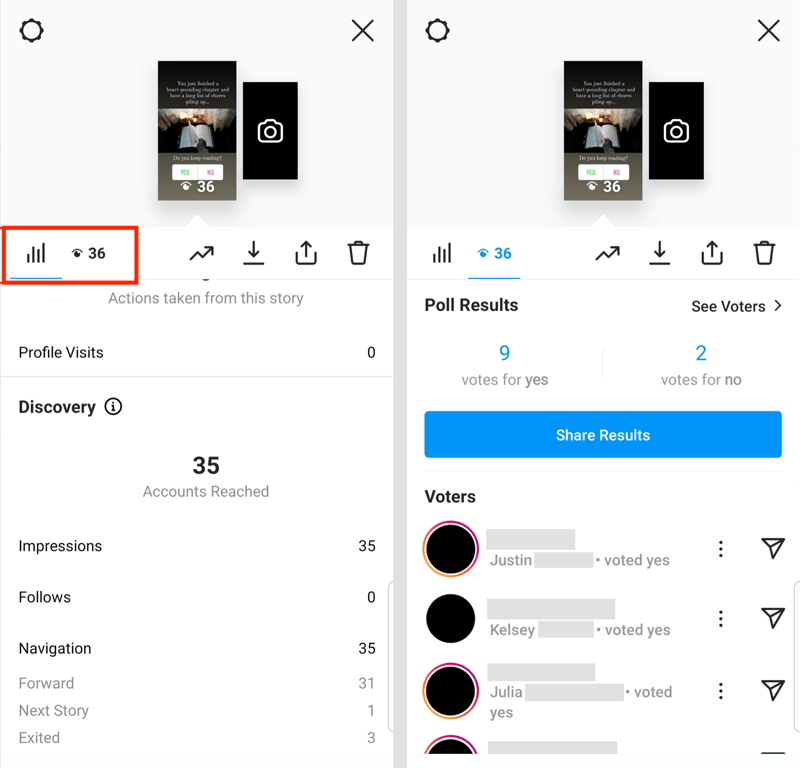
- Completion rate: Ideally, you want viewers to be engaged enough with your stories to watch or tap through to the end. You can calculate your completion rate by dividing the total number of viewers from your last slide by the number of viewers from your first slide. The average completion rate is 87%.
- Exited: When viewing your Instagram Stories analytics, one of the most important metrics to look at is how many people exited your story. This usually indicates a lack of interest, which you want to avoid in the future.
#3: Instagram Insights for IGTV Posts
Instagram Insights allows you to access analytical data for up to 2 years of IGTV posts.
Just like feed posts and stories, you'll find this data by going into your Insights Overview and scrolling down to the IGTV section of Content You Shared.

Discover Proven Marketing Strategies and Tips
Want to go even deeper with your marketing? Check out the Social Media Marketing Podcast! Publishing weekly since 2012, the Social Media Marketing Podcast helps you navigate the constantly changing marketing jungle, with expert interviews from marketing pros.
But don’t let the name fool you. This show is about a lot more than just social media marketing. With over 600 episodes and millions of downloads each year, this show has been a trusted source for marketers for well over a decade.
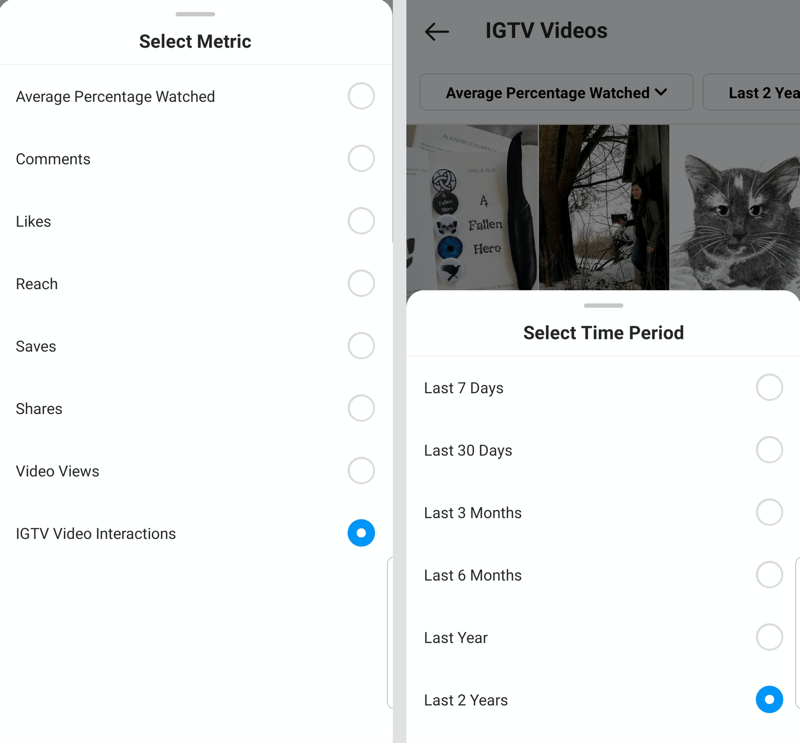
From here, you have two settings options to adjust based on the specific metrics you want to analyze.
You can filter your IGTV videos by average percentage watched, comments, likes, reach, saves, shares, video views, and IGTV video interactions, then select the time period you want to view.
If you want to see the Instagram analytics for a specific IGTV video, tap on the three-dots icon at the bottom of the screen while the video is playing.
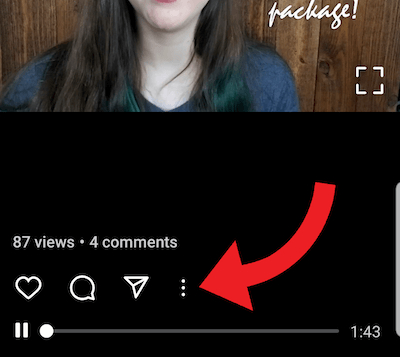
Then select View Insights.
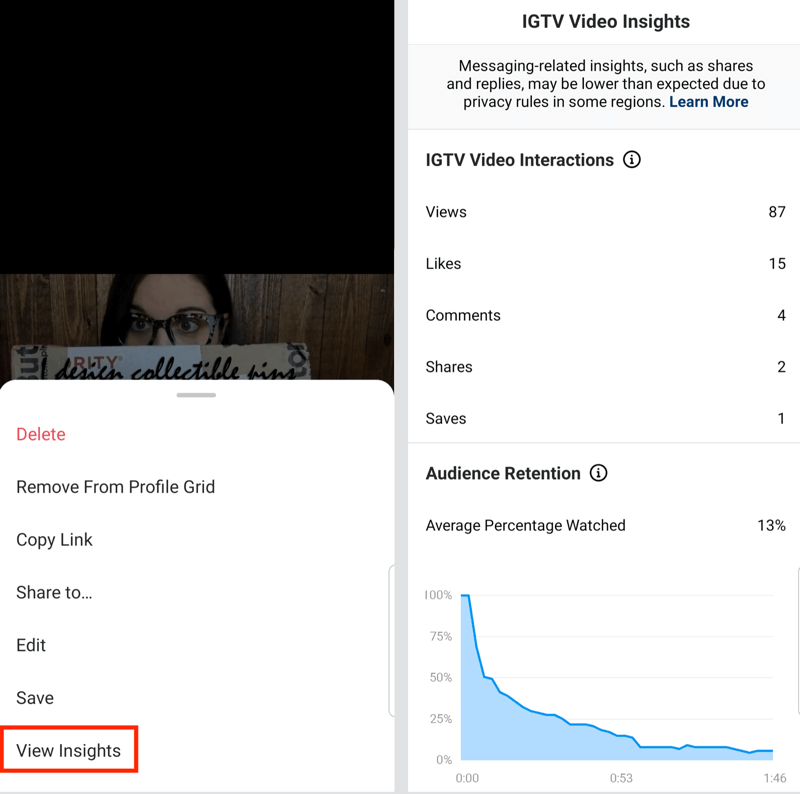
Instagram KPIs for IGTV videos:
- Views: Once someone spends at least 3 seconds watching your IGTV video, a view will be listed with the post.
- Engagement: Pay close attention to the likes, comments, shares, and saves. While views are important, these metrics provide better insight into whether people actively engaged with your video.
- Audience Retention: It's normal to see a steady drop-off over the course of an IGTV video, especially if the video is long. Even though IGTV videos can be longer than those uploaded directly onto Instagram, HubSpot found that 26-second videos tend to receive the most comments.
- Audience Percentage Watched: How long is too long? This metric helps you make that determination. If you notice that you're consistently posting 10-minute videos and your viewers almost always drop off 4 minutes in, that's a good indicator that your audience prefers 4- to 5-minute videos.
#4: Instagram Insights for Live Video Posts
Instagram Live videos have been trending over the past year, but until recently, none of the Instagram analytics tools provided data on live videos.
In May 2021, Instagram added Live to Insights at the same time it added analytics for Reels. All live streams created on or after May 24, 2021, have insights.
Just like the other features we've looked at so far, you can find Instagram Live analytics within the Insights Overview under Content You Shared. Analytics for Instagram Live include accounts reached, peak concurrent viewers, and live interactions such as comments and shares.
Instagram KPIs for live video posts:
- Accounts Reached: While it's important to know how far your reach was, audience engagement is a more valuable metric to measure the success of your content.
- Peak Concurrent Viewers: This metric tells you the maximum number of people watching the video at its peak.
- Live Interactions: Comments and shares help you understand whether people are truly engaged. If you have a high number of viewers but very few comments and shares, that's a red flag that your audience isn't really engaged in your content.
#5: Instagram Insights for Reels
Instagram launched Reels in 2020 and added analytical insights in May 2021. This section lives in the same place, under the Content You Shared categories within Insights.
Just like Instagram's other features, you can filter your Reels data by selecting a timeframe within the last 2 years and the metric to sort by, including comments, likes, saves, reach, plays, shares, and interactions.
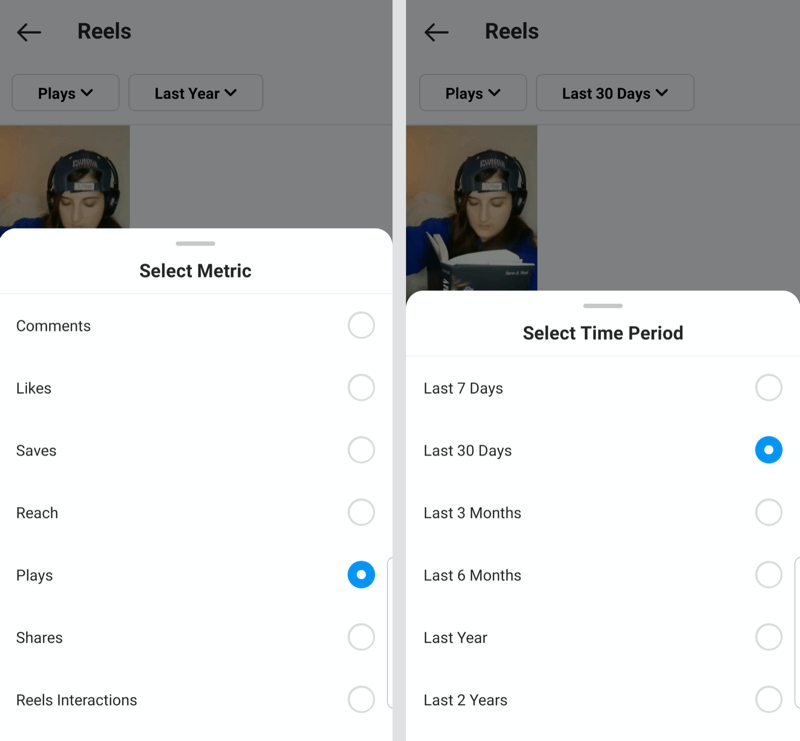
Within an individual reel, you can also see a specific breakdown of that video. Simply tap the three dots in the bottom right of your screen to see your options.
Then tap on View Insights.

Instagram KPIs for Reels:
- Accounts Reached: Reels reach an audience differently than regular posts. While you can share your reel to your profile as you would a normal video, your reel will also be shown in a curated feed within Reels that's customized for the viewer.
- Interactions: One 2020 study found that on average, Instagram reels have an average engagement rate of 2.7%. This is slightly higher than the average for regular videos.
#6: Instagram Insights for Guides
Instagram Guides is a new feature and there really aren't analytical tools for Guides yet. You won't find a section for Guides among your posts, stories, reels, or IGTV and live videos in the Content You Shared section of Insights, nor will you find any analytical data in the three dots on the guide itself.
At this time, Instagram Guides is a curation of existing places, products, and posts, so any views counted in the metrics are reflected in the original content rather than the guide. This may change as Instagram features and analytical insights continue to evolve.
#7: Instagram Insights for Highlights Albums
Analytical data for Instagram stories in a highlights album can be accessed the same way as you would a regular story—simply tap on the album to open it and then swipe up to view the insights. You'll be able to see interactions, profile visits, accounts reached, impressions, and new follows.
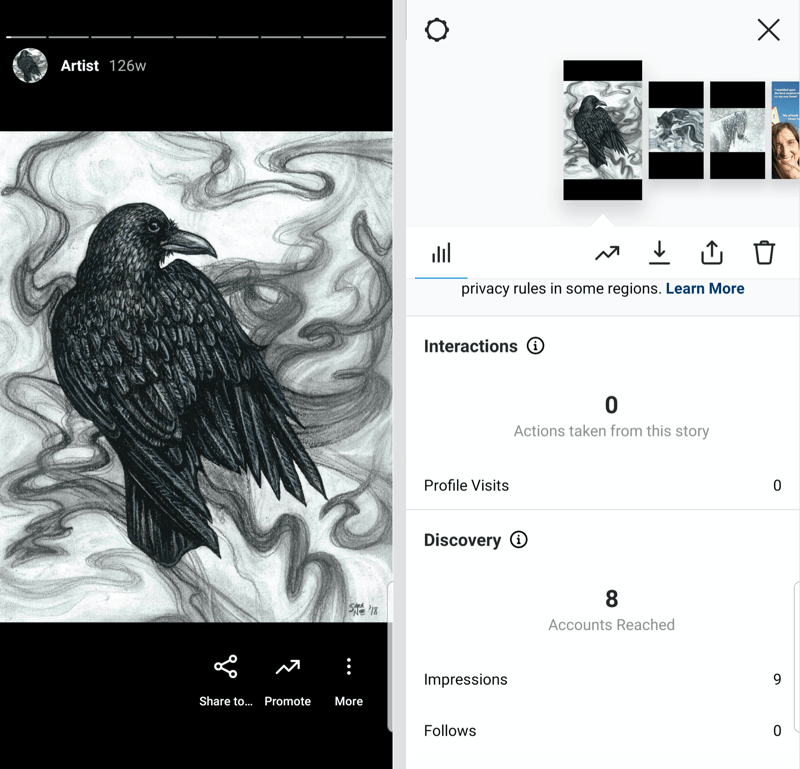
Instagram KPIs for highlights albums:
- Interactions: When people actively engage with your stories, those actions will show up in this section.
- Discovery: Reach and impressions seem similar but are actually different metrics. Reach reflects the accounts that have seen the story once. Impressions are the number of times your story was on-screen and may include multiple views of your story by the same account(s).
Bonus: Instagram Insights for Audience Data
Accessing the Instagram analytics for your audience will give you a precise breakdown of who's consuming your content.
You can see your audience growth and top cities and countries where your followers are located, as well as age range for men, women, or all followers, gender, most active times during each day, and the most active days of the week.
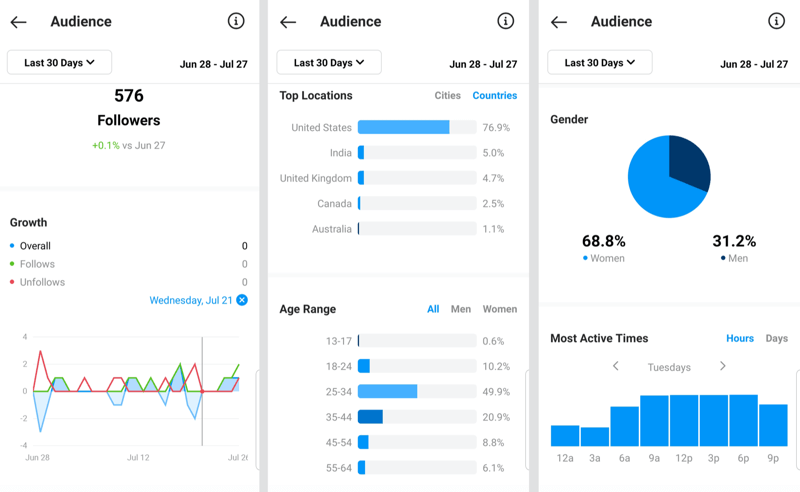
This information helps you develop your ideal customer persona and strategize your posting schedule to reach your followers when they're most active.
Instagram KPIs for audience:
- Follower Growth: This is an important metric to monitor as part of your content strategy so you can pay attention to cause-and-effect changes. For example, if you notice that posting a reel resulted in a noticeable bump in followers, that should be a factor in your future strategy. Monitor your follower growth in terms of percentages, not raw numbers. Good follower growth will range between 9% and 16%. You can expect the growth rate to vary depending on your profile size.
- Active Times: While general recommendations for the best times to post on social media can be a helpful guideline, that data isn't specific to your own unique audience. Instead, you should be relying on your personal data to know when your followers are most active.
Conclusion
Instagram Insights may not offer all of the same bells and whistles you can get when you pay for a third-party scheduling and analytics app, but for a free built-in service, it does an all-around good job at providing the data you need to understand your audience and update your content strategy plan.
Get More Advice on Instagram Marketing
- Grow and engage an audience on Instagram.
- Improve your Instagram engagement.
- Create ads specifically designed to sell products and services on Instagram.
Attention Agency Owners, Brand Marketers, and Consultants

Introducing the Marketing Agency Show–our newest podcast designed to explore the struggles of agency marketers.
Join show host and agency owner, Brooke Sellas, as she interviews agency marketers and digs deep into their biggest challenges. Explore topics like navigating rough economic times, leveraging AI, service diversification, client acquisition, and much more.
Just pull up your favorite podcast app, search for Marketing Agency Show and start listening. Or click the button below for more information.

