 Want to better understand your customer's journey across devices and channels? Have you heard of the Facebook Attribution tool?
In this article, you'll learn how to use Facebook's new Attribution tool to measure the effectiveness of your ads.
What Is the Facebook Attribution Tool?
Before we dive into the Facebook Attribution tool, it's worth looking at attribution in the wider context of digital marketing. If you ask any digital marketer about the biggest issues they face right now, one of the answers will certainly be attribution.
In its simplest form, attribution is the process of matching actions such as purchases to specific marketing channels so you can measure the impact of those channels on your business and determine the return on investment (ROI).
But here's the issue: people don't just buy products using one device in a single session. There's often more consideration required when purchasing, with multiple visits to a website over a longer period of time, particularly for high-priced items or services.
Also, with multiple advertising platforms competing to be responsible for your end result such as a lead or sale, it can be hard to attribute the final action to one specific channel.
Suppose someone searches for a product on Google, visits the website but doesn't buy on their first visit, and then clicks on a Facebook website remarketing ad for that same product and goes on to purchase it. Is Facebook responsible for that purchase or is Google (because it was discovered there first)?
Currently, with last-click attribution, that purchase would be attributed to Facebook, even though the original traffic source was Google.
Facebook's Attribution tool allows you to properly assess the full conversion path for the events that matter the most to your business. With it, you can analyze the true impact of your marketing across channels and devices, and effectively measure ROI.
Now that you know what the Attribution tool is, here's how to use it to better understand your customer's journey and use those findings to create more effective ad campaigns.
#1: Set Up the Facebook Attribution Tool for Your Business
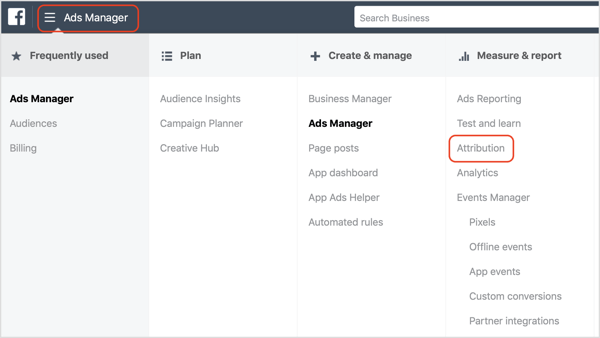
The first step in using the Facebook Attribution tool is to configure it based on your business type. In the Ads Manager main menu, navigate to the Measure & Report column and click Attribution.
Get World-Class Marketing Training — All Year Long!
Are you facing doubt, uncertainty, or overwhelm? The Social Media Marketing Society can help.
Each month, you’ll receive training from trusted marketing experts, covering everything from AI to organic social marketing. When you join, you’ll also get immediate access to:
- A library of 100+ marketing trainings
- A community of like-minded marketers
- Monthly online community meetups
- Relevant news and trends updates
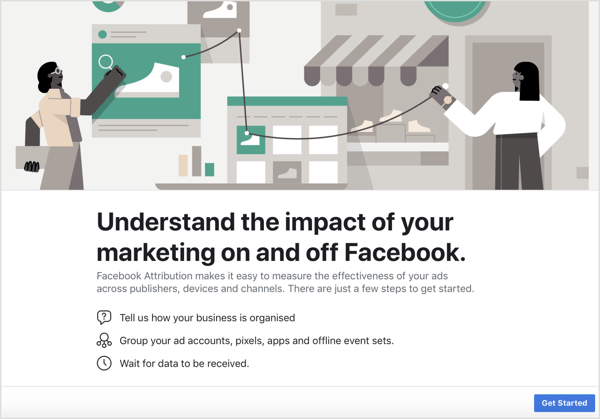
After the Attribution tool dashboard loads, you see a welcome screen. Click Get Started and a new window will appear where you choose how your business is organized.
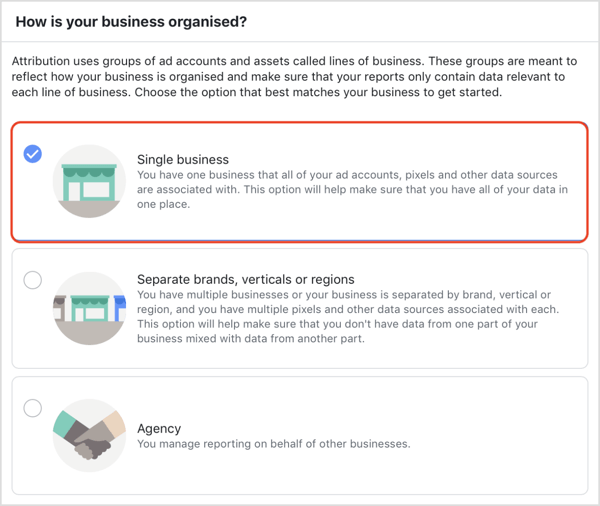
Facebook gives you multiple options: Single Business; Separate Brands, Verticals or Regions; and Agency. In this article, we'll look at how to set it up as a single business, so select Single Business and click Confirm.
Group Your Ad Accounts and Data Sources
Next, you'll see a row and multiple columns that say no ad account, pixel, or currency selected. Click the pencil icon and type in a name for your line of business. Then click Set Up Line of Business.
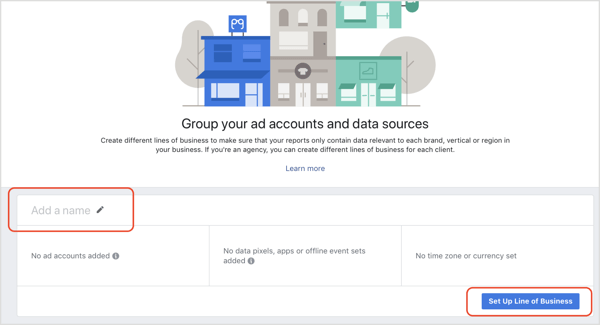
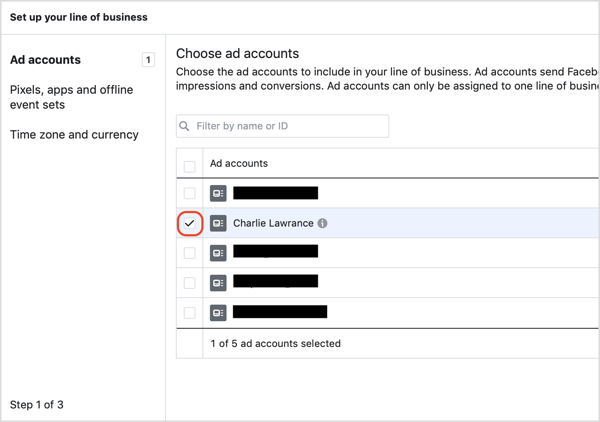
A new window will appear with a three-step process to select your ad accounts, data sources, currency, and time zone.
First, select your ad account from the list of ad accounts you have access to and then click Next.
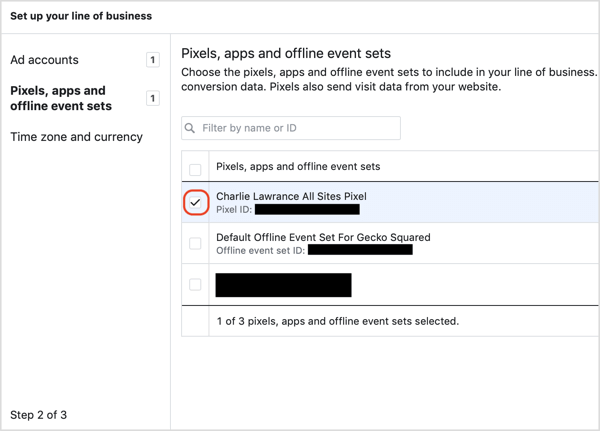
Now choose the pixel associated with your ad account. If you haven't installed the pixel yet, click to learn how to correctly set up and install the Facebook pixel on your website.
After you make your selection, click Next.
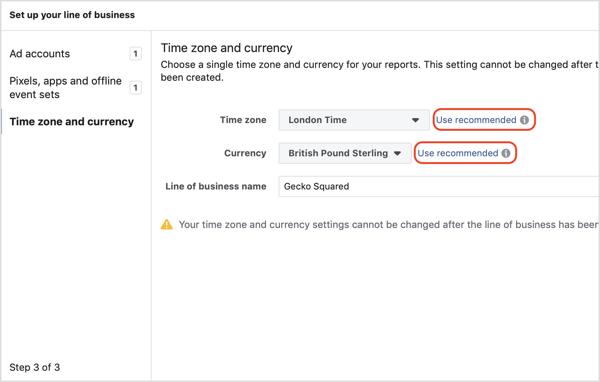
Finally, set your time zone and currency. You can't change these settings later so make sure they're correct.
Tip: click Use Recommended and Facebook will pull the time zone and currency from the linked ad account.
Once set, click Confirm.
You'll then be taken back to the main view, but this time, you'll see your ad account, pixel, currency, and time zone info. Click Finish.
On the next page, review your settings and if everything looks okay, click Finish. Your business line will load (it can take a few minutes) and then you'll see the Settings tab with a status bar for your setup.
There are three status stages: Line of Business Created; Clicks, Impressions, and Visits; and Conversions. You'll see a checkmark next to Line of Business, then you'll see Waiting for the next two stages.
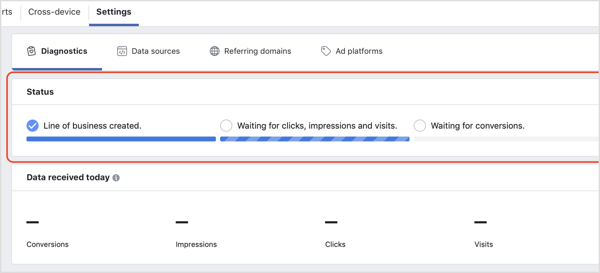
Wait for the data to populate from your campaigns and pixel. It can take an hour or more to start receiving data.
Check That You're Receiving Data
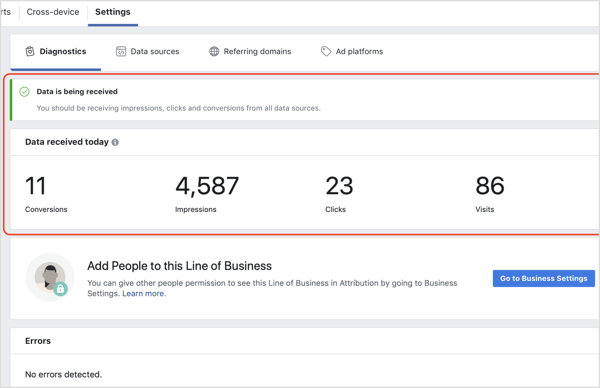
To check that your data is being received correctly, navigate to the Settings tab in the Attribution tool's dashboard and look for a green banner confirming that data is being received. Below that, you'll see a row of the event actions and visits received on the day you're checking it.
#2: View Your Facebook Attribution Tool Data
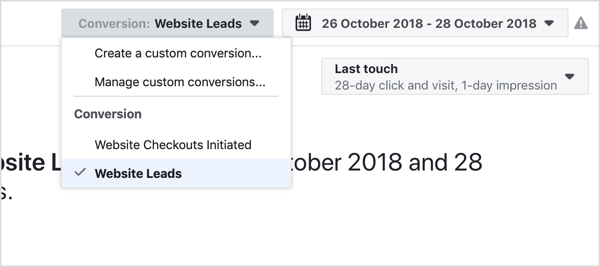
The Attribution tool allows you to analyze your results based on your conversion events. Once you've started collecting data, choose the conversion event you want to analyze from the drop-down list in the top-right corner.
The conversion events you see in the drop-down list depend on which events you've installed on your website. If you're tracking leads, you'll see Website Leads as an option. If you're an eCommerce company, you'll see various eCommerce actions such as Add to Cart, Initiate Checkout, and Purchase.
Specify a Timeframe for Data Analysis
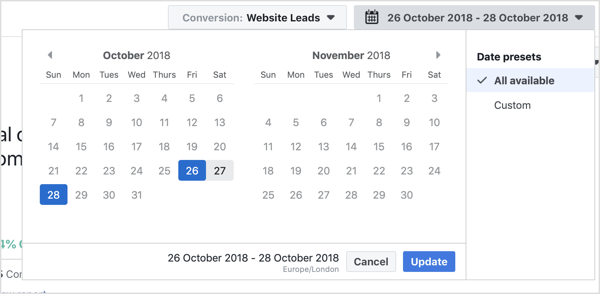
Once you've selected the conversion event, choose the date range you want to view.
The Attribution tool only populates data from the time you set it up; it doesn't populate historical data. So to analyze data over a weekly or monthly period, you'll have to wait 7-30 days from the time you set up attribution to actually analyze it.
However, you can start analyzing the data in the first 24-72 hours, depending on your daily ad spend and the number of conversion events recorded.
Set Your Attribution Model and Attribution Window
The final component to set when viewing attribution data is the choice of your attribution model and attribution window.
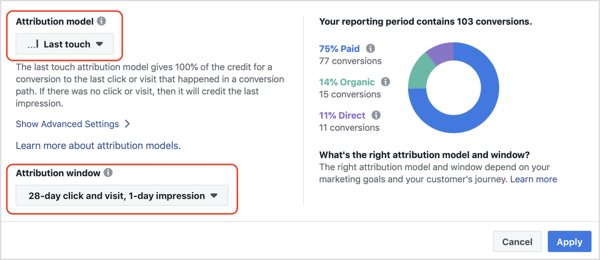
Here's where it gets interesting. Facebook has expanded the number of attribution models beyond the default last-click model you see in your regular Ads Manager reporting.
They've also introduced new shorter and longer attribution windows. If you have high daily budgets, you can get more granular with your data analysis. If you have lower daily budgets, you can get a big picture view over a longer period of time.

Discover Proven Marketing Strategies and Tips
Want to go even deeper with your marketing? Check out the Social Media Marketing Podcast! Publishing weekly since 2012, the Social Media Marketing Podcast helps you navigate the constantly changing marketing jungle, with expert interviews from marketing pros.
But don’t let the name fool you. This show is about a lot more than just social media marketing. With over 600 episodes and millions of downloads each year, this show has been a trusted source for marketers for well over a decade.
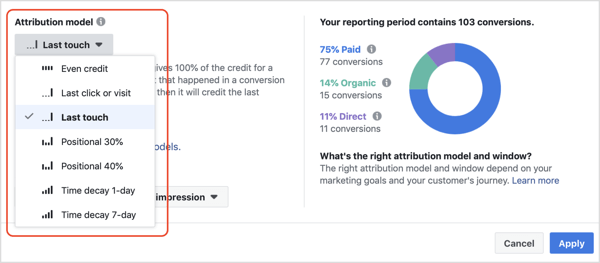
Facebook offers 7 different attribution models and 17 different attribution windows. Deciding which ones to choose can be daunting if you don't know how or when to use them. The attribution model you select will massively affect your data, because it determines how credit is given to touchpoints for the conversion event you selected earlier.
Different attribution models distribute different amounts of credit across your ads. Some give more credit to first and last touchpoints in your conversion path, while others just look at the last touchpoint or the touchpoints leading up to the conversion. The seven attribution models are:
- Even Credit
- Last Click or Visit
- Last Touch
- Positional 30%
- Positional 40%
- Time Decay 1-Day
- Time Decay 7-Day
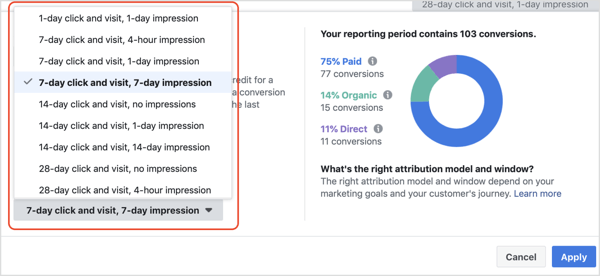
The attribution window you select determines which touchpoints are considered by the attribution model. To illustrate, 1 day click/1 day impression is the shortest window and will only include clicks and views that occurred in the day leading up to the conversion event.
In regular Ads Manager reporting, you can only select 1-day, 7-day, or 28-day, but Facebook's Attribution tool has expanded the options to include a 14-day, 30-day, and all the way up to a 90-day window. This is extremely useful for businesses with long conversion times over the standard 28-day window.
To be able to compare attribution models and see the big picture of your marketing efforts across channels, you need to start with a control model. Go with the default option, Last Touch, which gives 100% of the credit for a conversion to the last click or visit that happened in your sales funnel. If there was no click or visit, it will credit the last impression.
Because you've just set up the Attribution tool, the window you choose doesn't matter at this time. So select the default reporting window of 28-Day Click and Visit, 1-Day Impression.
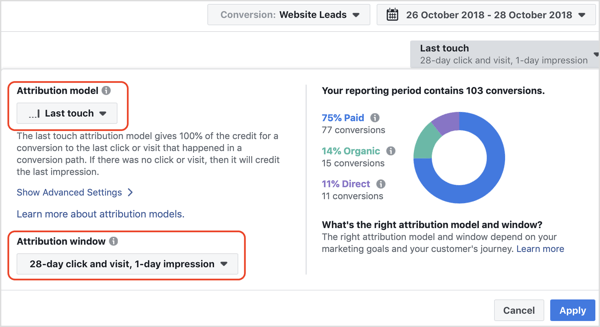
After you click Apply, your dashboard will load with relevant data.
#3: Analyze Your Data
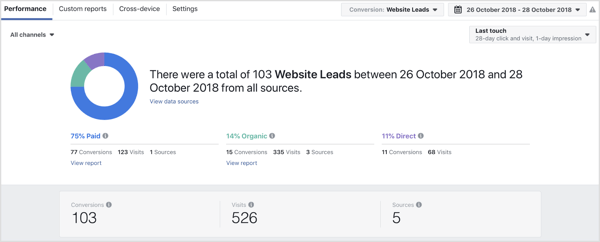
At the top of the dashboard, you'll see how many conversions there were of the event you selected in the date range you chose. Below that, view a breakdown by channel of where those conversions came from, as well as the total number of conversions, visits, and data sources.
Looking at the data below, you can see that 75% came from paid channels, 14% from organic, and 11% direct. There were 103 lead conversions from 526 visits from 5 different sources.
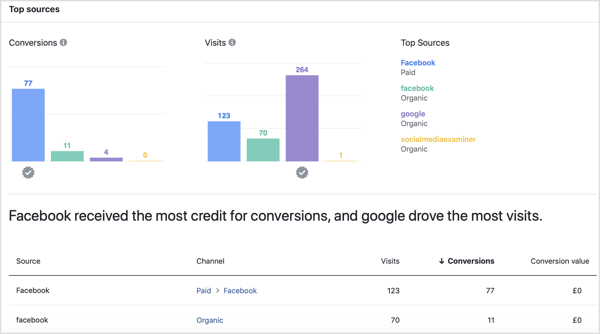
Keep scrolling down to see a Top Sources view, which highlights the sources of your conversions and visits. In the image below, Facebook received the most conversions, 77, but Google drove the most visits to the site, 264.
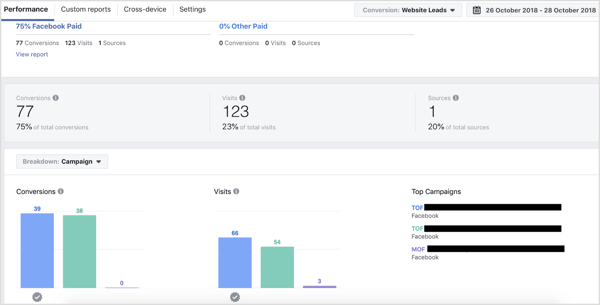
Scroll back up to the top of the dashboard to break down your results by channel type, in this case Paid and Organic.
Under the Paid section, you see a campaign breakdown highlighting the top campaigns that resulted in the most conversions for your chosen event.
Use Cross-Device Reporting to See How Your Conversions Occurred on Different Devices
One of the useful features of the Attribution tool is that it will show you whether people interact with your ads on multiple devices and what percentage of those who interacted on mobile later converted on desktop and vice versa.
Looking at the data below, the top conversion flow shows that no conversions were recorded from mobile devices after they had interacted with ads on desktop, meaning the majority of conversions were mobile only.
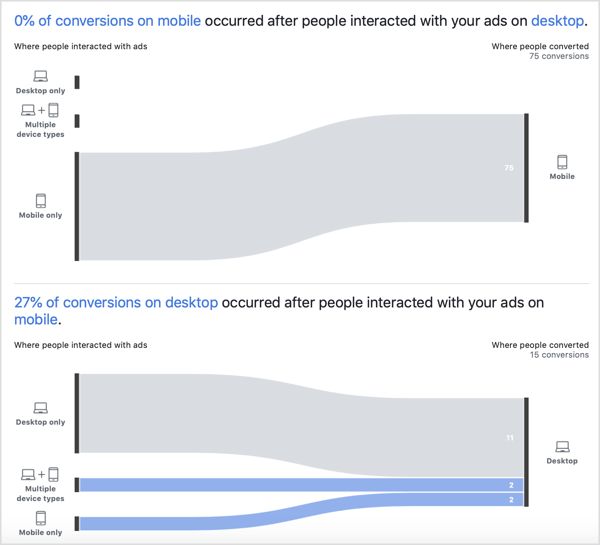
The second conversion flow shows that of the 15 desktop conversions recorded, 27% (4) occurred after an interaction with an ad on a mobile device or multiple devices. This means people switched devices from mobile to desktop, but the majority who were shown desktop ads converted on desktop.
Compare Positional Attribution Models With the Control for a Full Conversion Path View
Once you have your control data using the Last Touch attribution model, you can select other positional and time decay models to analyze your full conversion path from first to last touchpoint.
There are two different positional attribution models, 30% and 40%. The positional model gives weighted credit to the first and last touchpoints, with middle touchpoints receiving less credit.
This model better reflects how all touchpoints help lead to the conversion event you're measuring, and the important role in the first touchpoint of discovery and the last before conversion.
If you change the attribution window to Positional 30%, which gives 30% of the credit to the first and last touchpoints and the remaining 40% to the middle touchpoints, the conversions volume changes for each of the channels.
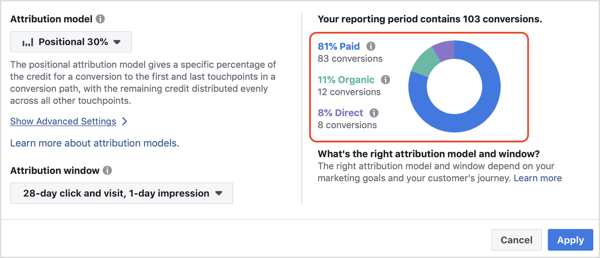
It attributes more conversions to Paid channels (in this case Facebook) and increases conversions from 77 to 83. Therefore, it decreases Organic from 15 to 12 conversions and Direct from 11 to 8 conversions. This shows that the Facebook ads had a greater impact than previously thought.
Compare Time Decay Attribution Models With the Last-Touch Control
Finally, you want to compare the time decay attribution model with that of your control—last touch—but also the positional model. The time decay model gives an increasing percentage of the credit for your conversion event to the touchpoints as they get closer in time to the conversion.
There are two types of time decay models: 1-day and 7-day. A longer half-life such as 7-day leads to a more even distribution of credit among your touchpoints, whereas the shorter 1-day gives more credit to the most recent touchpoints.
To visualize this, with the 1-day time decay, the touchpoint that happens 1 day before the conversion event gets 50% of the weighting, 2 days before gets 25%, and so on until all credit is distributed across your touchpoints based on your attribution window.
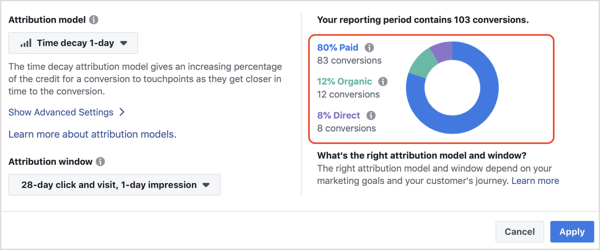
Compared with last touch, it better highlights how all touchpoints lead to your conversion event, but weights them in a way that more accurately matches how your target audiences interact and consider ads the closer they get to making the conversion decision.
In the data above, it has weighted more credit to paid channels when comparing it to the control of last touch. Paid has increased from 77 to 83 conversions and organic and direct have decreased from 15 to 12 and 11 to 8 conversions, respectively.
Again, as with the positional model, this model shows that paid Facebook ads had a bigger impact on conversions, particularly at the touchpoints closest to the time of conversion.
Conclusion
You can use the findings from the Facebook Attribution tool to improve your ad campaigns and wider marketing efforts based on the effectiveness of different channels and the sources within them.
How you use the Attribution tool will depend on what you're advertising. The lead example used in this article is for a free opt-in, which doesn't require as much consideration. Therefore, there are fewer touchpoints and one clear winner when it comes to the most effective channel and source.
If your product or service offering requires greater consideration due to its complexity or high price point, there will be more touchpoints. So for full cross-channel attribution, it's worth using a positional model to gauge initial discovery and final conversion, as well as comparing it with a time decay model.
Finally, you have to retrospectively take action on the findings from the attribution dashboard because you can't adjust your campaigns from within the tool just yet. This is similar to the Test & Learn tool.
What do you think? Have you used the Facebook Attribution tool? How are you using the data to improve your campaigns? Please share your thoughts in the comments below.
More articles about Facebook ads:
- Discover seven advanced tips to improve the performance of your Facebook advertising campaigns.
- Learn how to set up a Facebook Ads Manager report that quickly reveals which ads are working well and which you need to adjust.
- Find out three ways to lower your Facebook ad costs and get better results.
Attention Agency Owners, Brand Marketers, and Consultants

Introducing the Marketing Agency Show–our newest podcast designed to explore the struggles of agency marketers.
Join show host and agency owner, Brooke Sellas, as she interviews agency marketers and digs deep into their biggest challenges. Explore topics like navigating rough economic times, leveraging AI, service diversification, client acquisition, and much more.
Just pull up your favorite podcast app, search for Marketing Agency Show and start listening. Or click the button below for more information.

