Looking for a faster way to visualize and make sense of your marketing metrics? Have you heard of Google Data Studio?
In this article, you'll learn how to build a reusable report in Google Data Studio.
Why Use Google Data Studio to Simplify Marketing Measurement Analysis
When you're a small business with a limited marketing budget, it can be difficult to identify which social media marketing efforts are working the best. Sifting through spreadsheets and Google Analytics reports can be daunting—not to mention time-intensive—if you're not super comfortable with data and math.
This is why setting up a dashboard can be a good solution. It can help you quickly find answers to pertinent questions and make more informed decisions without spending hours crunching numbers in Excel.
Follow the steps below to create your own custom marketing dashboard with Google Data Studio. The best part is that you can do this for free.
#1: Decide What You Want to Measure
When you read tactical articles like this one, it can be tempting to create a Google Data Studio account and immediately start building out a dashboard. However, I strongly encourage you not to do that right away. Instead, think about your marketing goals and define what you want to measure first. After all, if you can't measure it, you can't manage it.
One of the biggest mistakes that I see brands make is trying to measure anything and everything. That's how you wind up with 25+ page weekly or monthly marketing reports that no one reads. Instead, it's better to focus on three core KPIs and then about a dozen sub-KPIs. Your core KPIs should tie back to a monetary value. You know it's a core KPI if you can answer these questions:
- Does it increase revenue (i.e. growth metrics)?
- Or does it decrease costs (i.e. retention metrics)?
Everything else is a vanity metric. Vanity metrics aren't necessarily bad; however, they need additional context to be relevant. For example, some common vanity metrics are the number of Instagram followers, net email subscriber growth, and any social media engagement metrics.
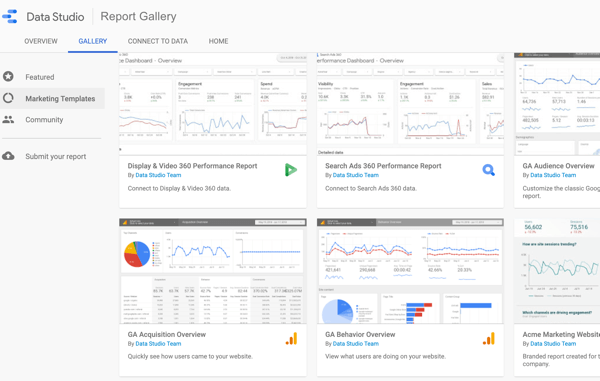
Pro Tip: For some insight into what metrics other brands are tracking, check out Google Data Studio's Report Gallery. It has an entire section devoted to marketing templates.
If you're a SaaS business with a heavy focus on content marketing, for instance, the core three KPIs you care about might be how your marketing efforts impact monthly recurring revenue (i.e. MRR), customer lifetime value (LTV), and churn or cancellations.
Some important sub-KPIs you may want to pay attention to are customer acquisition cost for each marketing channel (CAC), referral sources, traffic by source/medium/channel, Domain Authority (DA) or Domain Rating (DR), blog sessions, blog unique visitors, time on site, social media shares, backlinks, new inbound leads, percentage of inbound leads that are marketing-qualified (MQLs), etc.
Use Data to Tell a Story
Just like you use words to tell a story, you can do the same with data. The problem is that most of us are trained to think of data more like a Magic 8 Ball. Ask a question, shake the ball a few times, and you automagically get answers.
Get World-Class Marketing Training — All Year Long!
Are you facing doubt, uncertainty, or overwhelm? The Social Media Marketing Society can help.
Each month, you’ll receive training from trusted marketing experts, covering everything from AI to organic social marketing. When you join, you’ll also get immediate access to:
- A library of 100+ marketing trainings
- A community of like-minded marketers
- Monthly online community meetups
- Relevant news and trends updates
However, the quality of the questions you ask has a significant impact on what data you look at and the conclusions you draw. Specifically, the more focused the question, the more specific and actionable your findings will be. I like to use the focusing question from Gary Keller's bestselling book The One Thing: “What's the one thing you can do such that by doing it everything else will be easier or unnecessary?”
#2: Create an Outline for Your Marketing Measurement Dashboard
To tell a more cohesive and compelling story with your marketing data, you need to create an outline. I can't stress this enough. The more thought you invest into mapping out and outlining your marketing dashboard, the easier it will be to build it.
You can outline your dashboard digitally using a tool like Figma (free version available), Sketch (30-day free trial; $99/yearly), Balsamiq ($9/per month), or Google Drawings (free for Gmail/Google apps users). Or you can freeform it in a journal or notebook.
I like to do this process digitally; however, it doesn't matter how you choose to outline your dashboard as long as you actually do it.
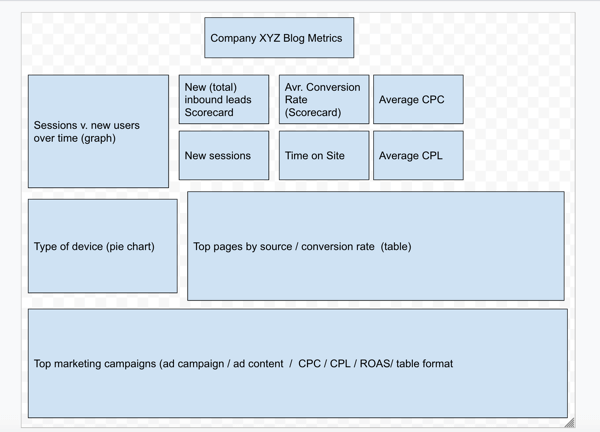
For my outline, I like to focus on the “meat” of the dashboard—the metrics or what I'm going to measure. Often, we obsess over the design and layout, because it's fun to think through that. If you start with the design, though, you'll end up doing a lot more work. It's much faster to think through the substance of the dashboard, which will then inform the look and feel.
Below is an example of a basic outline for a blog dashboard. As you can see, it won't win any design awards, but it does ensure that you know what you're building.
#3: Connect Google Data Studio With Your Data Source
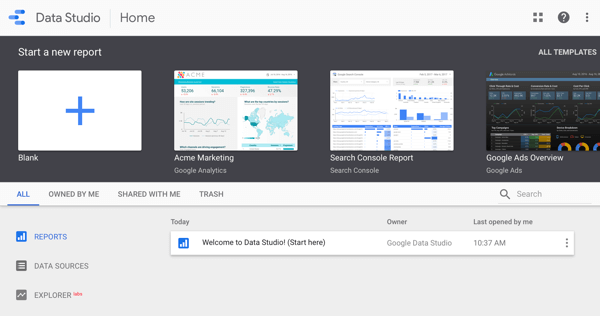
Once you've developed an outline, the next step is to create a Google Data Studio account. All you need to get started is a Gmail or Google apps email address. Here is where you can create your Google Data Studio account. (It's free!)
Pro Tip: Make sure you use the same email address as the one you use for Google Analytics.
In addition to maximizing what you can do in Google Data Studio, the following actions can help spruce up your analytics account:
- Make sure you're using goals.
- Enable ecommerce tracking and check that it's working correctly.
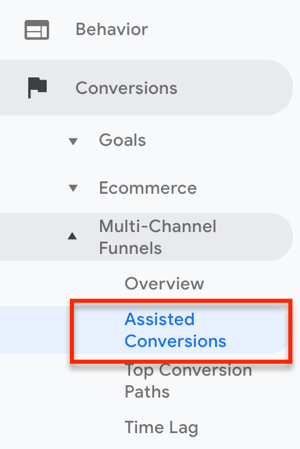
- Set up multi-channel funnels and assisted conversions.
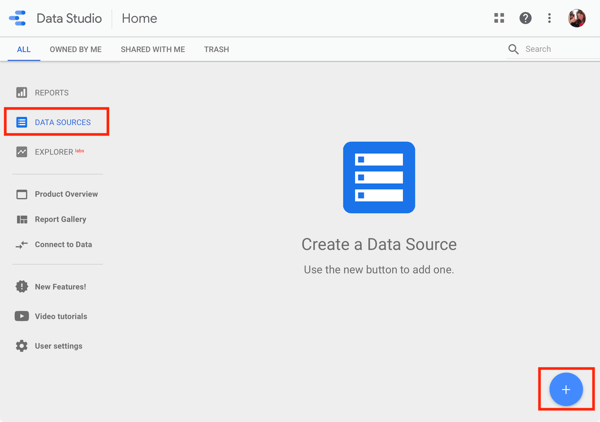
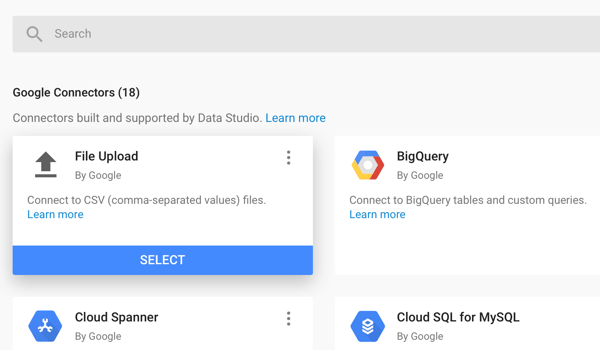
The next step is to connect your data sources in Google Data Studio. Click Data Sources in the left navigation and then click the + button on the right.
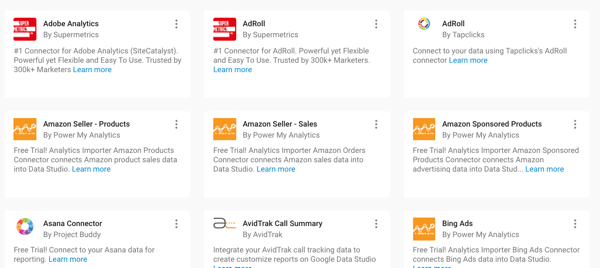
You can connect three different types of data sources: Google connectors (i.e. built-in/direct integrations), partner connectors (third-party integrations), and open-source connectors.
You'll find over 135 partner connectors that let you pull in everything from Facebook and Instagram ad insights to Bing ads, Reddit insights, Quora ads, Amazon Seller stats, and customer support call-tracking metrics.
If you don't see a data source for the specific metric you need, you can always import it yourself through a CSV file, MySQL query, or custom JSON or XML file.
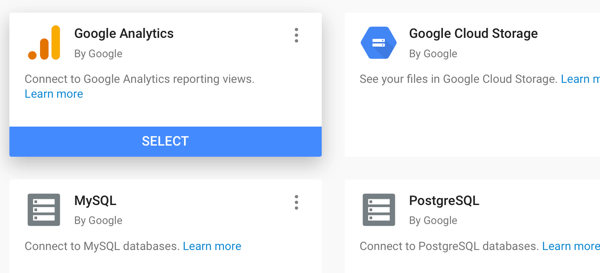
For the purpose of this article, we'll stick with Google Analytics, because it's the easiest data source to start with as well as one of the most versatile. As you get more comfortable, I encourage you to check out many of the other data sources.
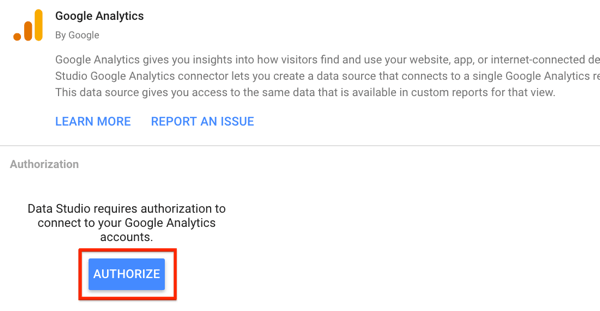
After you select the Google Analytics data source, click Authorize to add your account to Google Data Studio.

Discover Proven Marketing Strategies and Tips
Want to go even deeper with your marketing? Check out the Social Media Marketing Podcast! Publishing weekly since 2012, the Social Media Marketing Podcast helps you navigate the constantly changing marketing jungle, with expert interviews from marketing pros.
But don’t let the name fool you. This show is about a lot more than just social media marketing. With over 600 episodes and millions of downloads each year, this show has been a trusted source for marketers for well over a decade.
You're then prompted to log into your Google Analytics account. When you're done, click Connect.
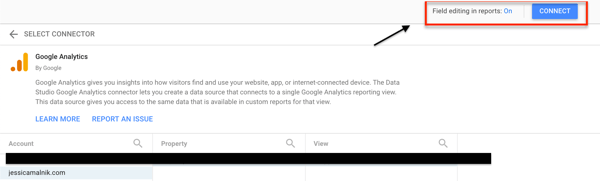
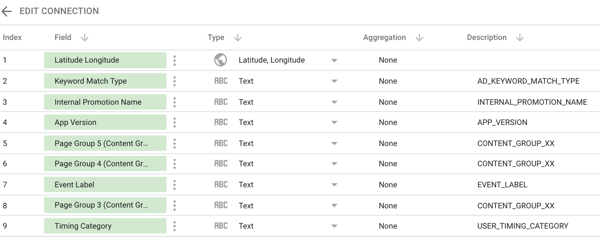
Google Data Studio now generates all of the data fields. You have the option to search these fields as well as add new fields to the list. When you're done, click Create Report in the upper-right corner of the page.
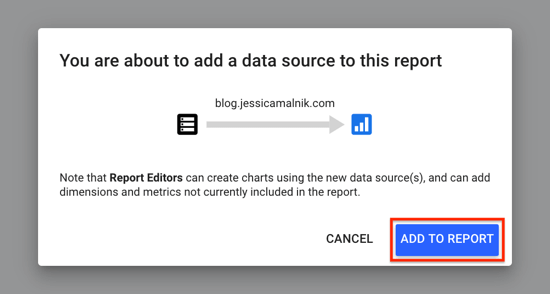
When you see the pop-up window below, click Add to Report to pull your data into your new dashboard so you can start working with it.
Note: To add more data sources (such as Google Search Console, Google Ads, etc.), repeat the same steps as above.
#4: How to Build Your Google Data Studio Dashboard
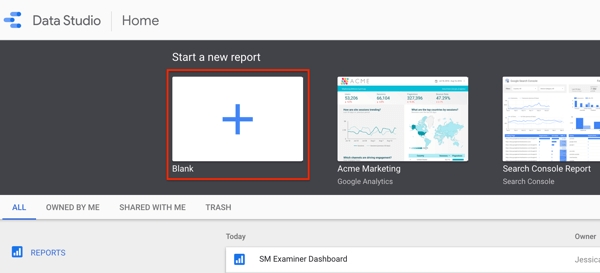
Google Data Studio has many default templates that you can work from. However, I recommend building a dashboard from scratch because you already know what you're measuring and have an outline. Starting with a blank report is less work than trying to revise and rebuild an existing template.
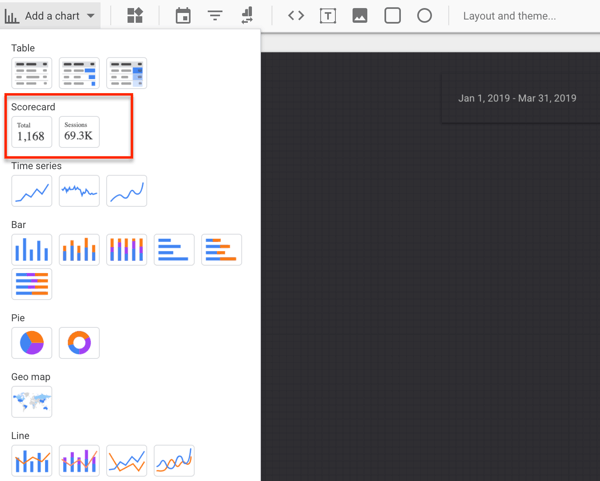
There are many different types of charts, tables, graphs and scorecards that you can add to your dashboard in Google Data Studio. You can also upload your own images, embed HTML, and add dynamic filters and segments.
If you have used a WYSIWYG web builder or CMS, you'll find that the process for adding and customizing charts in your dashboard works similar to customizing a DIY website or template.
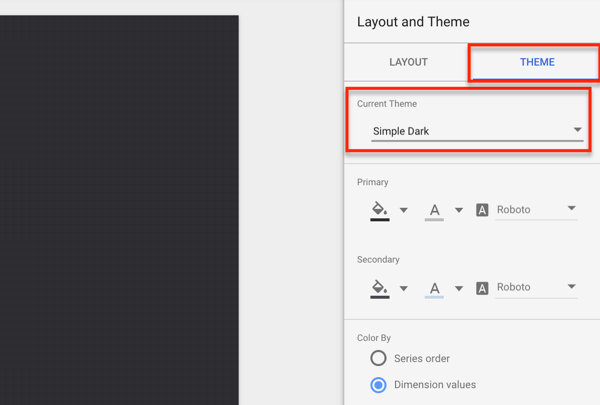
The first thing to do is to choose a theme and layout using the Style Settings.
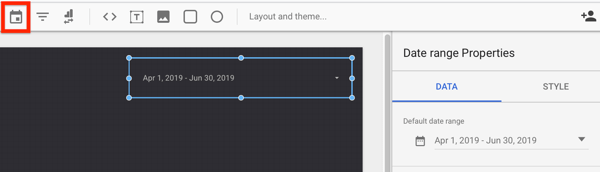
Next, click the Date Range toolbar button to add a date filter. I recommend setting the default date range for 30 or 90 days depending on the account, site traffic, and marketing goals. For accounts with less than 10,000 monthly visitors, stick with 90 days as your default.
Note: You'll be able to filter and adjust the date dynamically after you've built the dashboard.
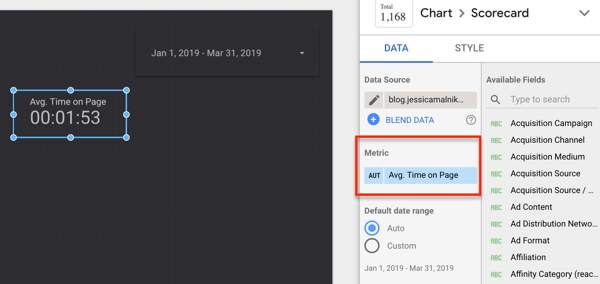
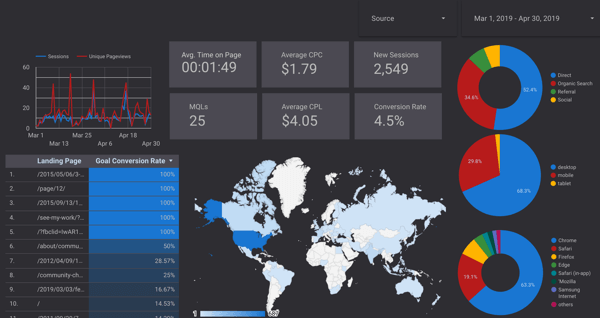
Now, it's time to start adding your charts. The easiest chart to add is the scorecard.
You'll want to customize the metric, which is a certain KPI indicator such as sessions, unique pageviews, conversions, etc. In this example, the metric is Average Time on Page.
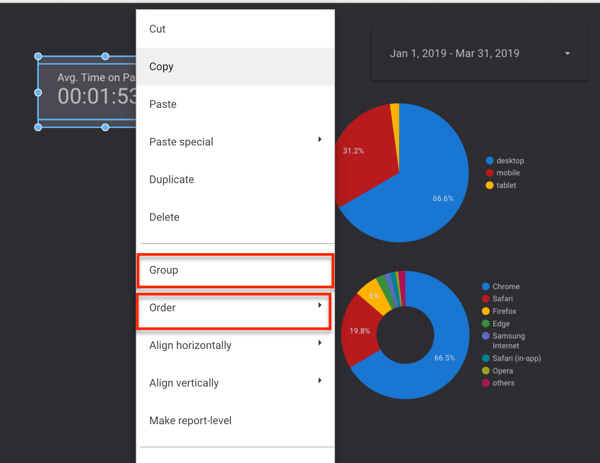
With scorecards, I like to add a background rectangle behind the text to make it stand out on the page. To do this, you need to group the text together and make sure it's sent to the front. The process is similar to using graphic design software like Canva or Photoshop.
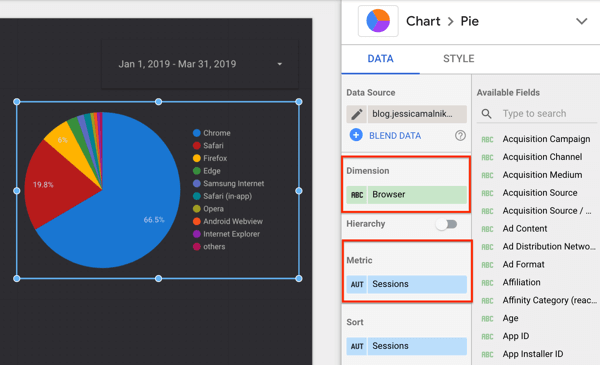
Another common chart to add to your dashboard is the pie chart. For instance, you might use a pie chart to see the percentage of users who view your site from different web browsers (i.e. Chrome, Safari, Firefox, etc.).
In this case, you'd add both the dimension and metric. The metric is Sessions, and the dimension is Browser (the browser that visitors used to view your site).
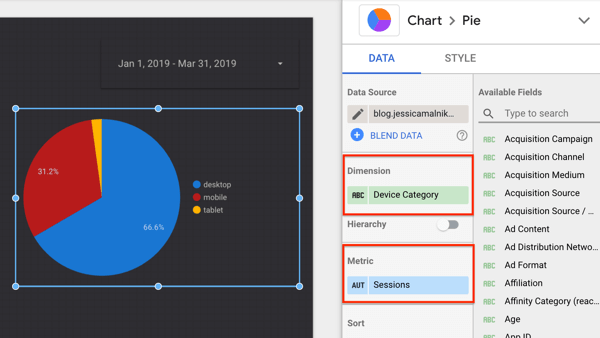
You also might use a pie chart to see what devices people are using to browse your site. Here the dimension is Device Category, and the metric is Sessions.
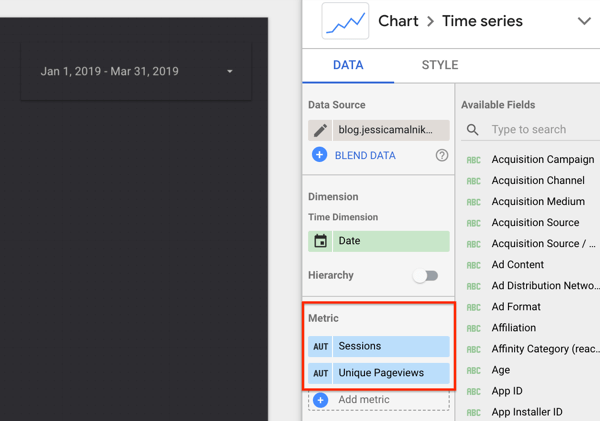
You can also add bar and line charts to your dashboard. For both, you can add multiple dimensions and metrics (such as Unique Pageviews and Sessions) to view trends over time.
Tables work particularly well when mapping out and tracking paid advertising account data from within Google Analytics. Here's how to set this up:
- Add two dimensions: Campaign and Ad Content. This allows you to segment your ads by the overall campaign and individual ad creatives.
- Add a minimum of three metrics, such as Transactions, ROAS, and CPC.
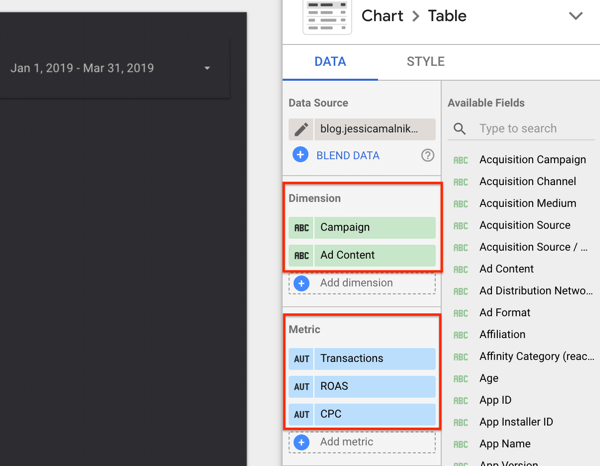
Pro Tip: To set up a table like the one above, you need to use UTM codes for all of your ad campaigns.
It's a good idea to also add at least one or two filters in addition to a date filter. I like to filter by either source or medium. This lets you see how people interact with your site when they come from different sources, such as Google, Facebook, LinkedIn, etc.

Here's what a basic dashboard with one source filter looks like.
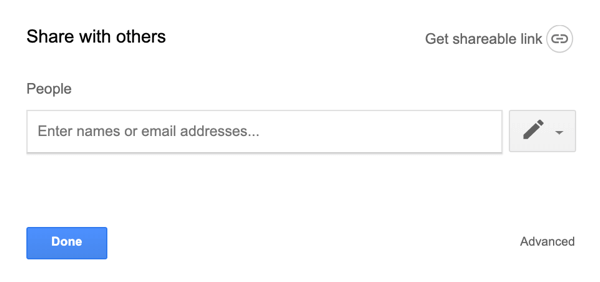
Once you've created your marketing dashboard, you can share it the same way that you share Google sheets and docs.
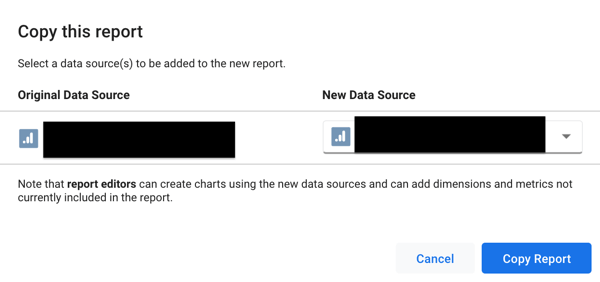
You can even save it as a template, which will save you a lot of time in the future.
Conclusion
The steps above show you how to connect Google Data Studio with Google Analytics data and set up a custom marketing dashboard. As you get more comfortable with this tool, you'll likely end up connecting more data sources.
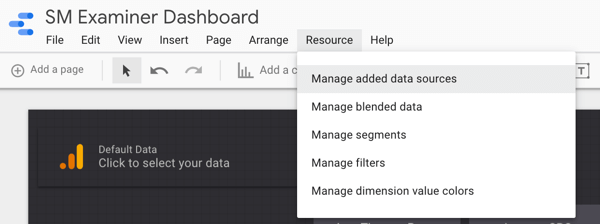
There are many more Google Data Studio features you can use to refine your dashboard. Click the Resource menu at the top of the page to connect additional data sources, blend data, and add segments.
What do you think? Will you try building a marketing dashboard with Google Data Studio? What KPIs do you look at when analyzing your marketing campaigns? Do you have any favorite tips or tools for building out marketing dashboards? Let us know in the comments.
More articles on Google Data Studio:
- Discover how to use Google Data Studio to analyze your Facebook ads.
- Learn how Google Data Studio helps you create dashboards and share data.
- Find out how to use Google Data Studio to create easy-to-update reports on your website, Facebook, or Instagram marketing.
Attention Agency Owners, Brand Marketers, and Consultants

Introducing the Marketing Agency Show–our newest podcast designed to explore the struggles of agency marketers.
Join show host and agency owner, Brooke Sellas, as she interviews agency marketers and digs deep into their biggest challenges. Explore topics like navigating rough economic times, leveraging AI, service diversification, client acquisition, and much more.
Just pull up your favorite podcast app, search for Marketing Agency Show and start listening. Or click the button below for more information.
