Want to know if your Instagram Stories content is working? Wondering how to make sense of Instagram Stories Insights?
In this article, you'll discover seven key Instagram story metrics that reveal what content piqued users' interest, where interest may have dropped off, and whether people are taking action and engaging with your stories.

Note: This article assumes you know how to access Instagram Stories Insights for your Instagram business account. Read this article for instructions.
#1: Find Out How Many People Watch Your Entire Instagram Story
The completion rate metric can give you a feel for how engaging your Instagram Stories content is. A high completion rate means people are taking the time to watch or tap through each slide (a single photo or video posted on your story) until reaching the end. This can help you determine whether you're posting too many slides or the right kind of content for your audience.
To calculate this metric, divide the total number of viewers of your last Instagram story slide by the number of people who saw the first slide.
reach of last slide / reach of first slide = completion rate
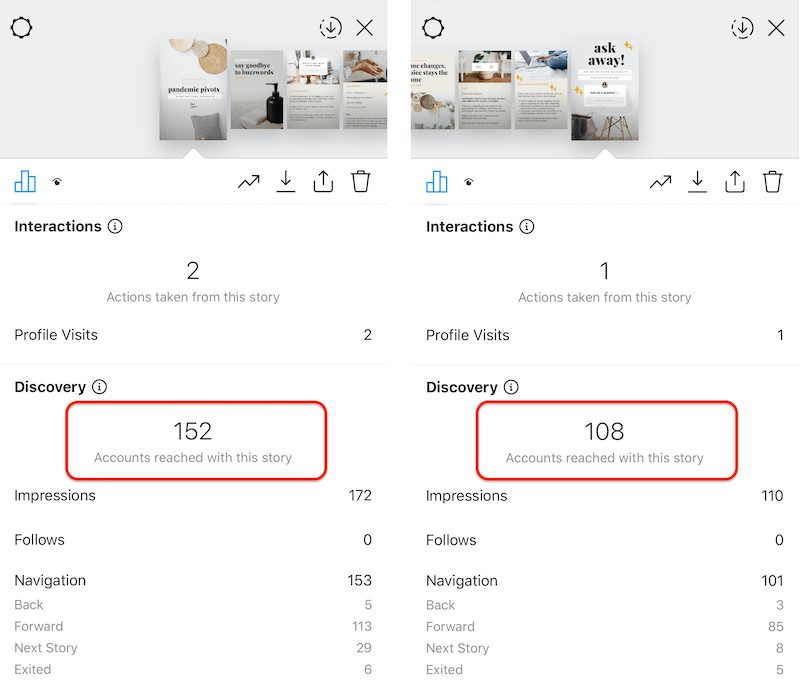
Let's say your first Instagram story slide had a reach of 152 and your last slide had a reach of 108. Your completion rate would be 71%.
Example: 108 / 152 x 100 = 71% completion rate
Upload a Complete Series at Once
When posting to Instagram Stories, batch-upload all of the slides in a series instead of posting them individually throughout the day. By uploading them in one segment, you can more easily determine the completion rate and analyze how the series performed from beginning to end.
Do some testing to see how many Instagram story slides are a good number for your content and audience. In general, the shorter the content to consume, the higher the completion rate.
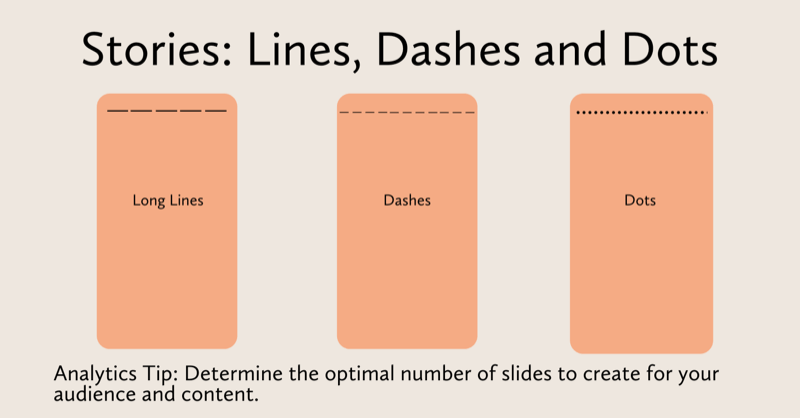
Try sharing 3–5 slides in a story series to see what resonates. Remember that you want viewers to see long lines or dashes instead of dots at the top of the screen, indicating the amount of the content to consume.
Instagram Stories Reach vs. Impressions
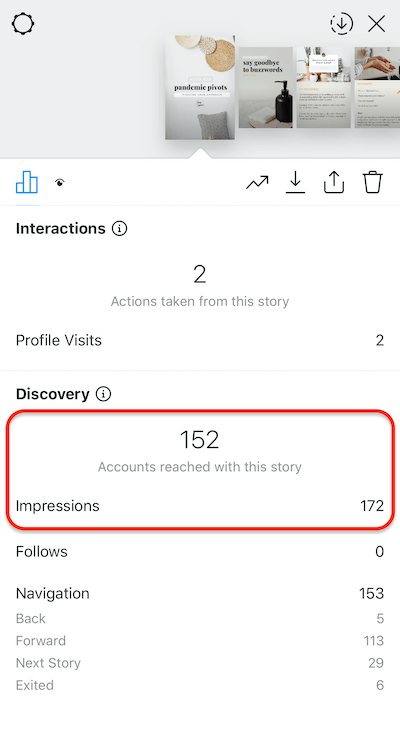
The reach metric represents the number of unique Instagram accounts that saw a photo or video in your story. Impressions is the total number of views on each slide in your story.
Get World-Class Marketing Training — All Year Long!
Are you facing doubt, uncertainty, or overwhelm? The Social Media Marketing Society can help.
Each month, you’ll receive training from trusted marketing experts, covering everything from AI to organic social marketing. When you join, you’ll also get immediate access to:
- A library of 100+ marketing trainings
- A community of like-minded marketers
- Monthly online community meetups
- Relevant news and trends updates
Your impressions will always be higher than your reach because impressions represents total views rather than unique views. If the number of your total impressions is significantly higher than your reach, it could mean that your slide was replayed multiple times or that the location sticker or hashtag you used helped increase the impressions.
Tracking your Instagram stories' reach over time will help you gauge how your content could be impacting your engagement and growth. If you notice your reach is declining as each slide progresses, re-evaluate the type of content you're sharing. It's good to mix things up every so often so be sure to track your reach to get a pulse on what's working.
#2: Learn How Many People Drop Off After the First Instagram Story Slide
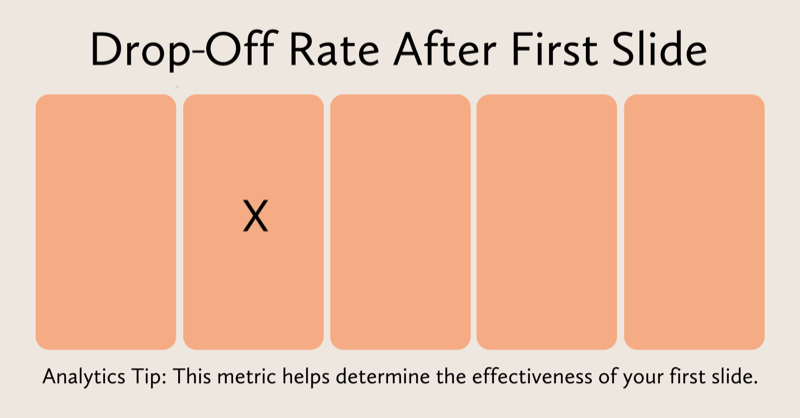
The first slide of your Instagram story needs to grab your audience's attention so they keep watching. Measuring the drop-off rate after the first slide will tell you how many people dropped off after viewing the first slide in your series.
To calculate this metric, take the number of users reached on your first slide and subtract the reach from the second slide. Then divide that number by the reach of the first slide.
(reach of first slide – reach of second slide) / reach of first slide = drop-off rate after the first slide
To illustrate, if your first Instagram story slide had a reach of 1,650 and your second slide had a reach of 1,430, your story drop-off rate after your first slide would be 13%.
Example: (1,650 – 1,430) / 1,650 = 0.13 x 100 = 13% drop-off rate after the first slide
Establish a Benchmark
Measure the drop-off rate after your first Instagram story slide so you can create a benchmark for your account. This benchmark will help you improve how you tease or present content and improve your retention rates over time.
#3: Learn How Many People Leave in the Middle of Your Instagram Story
You also want to measure the number of people who tapped out somewhere between the first and last slide of your Instagram story series. This drop-off rate lets you know what percentage of people exited your Instagram story before reaching the end.
To calculate this metric, take the number of people reached on your first slide and subtract the number of people reached on the last slide. Then divide by the number of people reached on the first slide.
(reach of first slide – reach of last slide) / reach of first slide = drop-off rate
If your first Instagram story slide had a reach of 1,650 and your last slide had a reach of 1,300, your Instagram story drop-off rate would be 21%.
Example: (1,650 – 1,300) / 1,650 = 0.21 x 100 = 21% drop-off rate
Mix Up Your Visuals and Text to Keep Viewers Engaged
Mix up your Instagram story content with videos and images to keep your audience's attention. Also incorporate animated text, stickers, and polls throughout your story series to encourage engagement.
Additionally, you can use the insights you've gathered here to find the sweet spot for how many slides your audience typically prefers to consume.
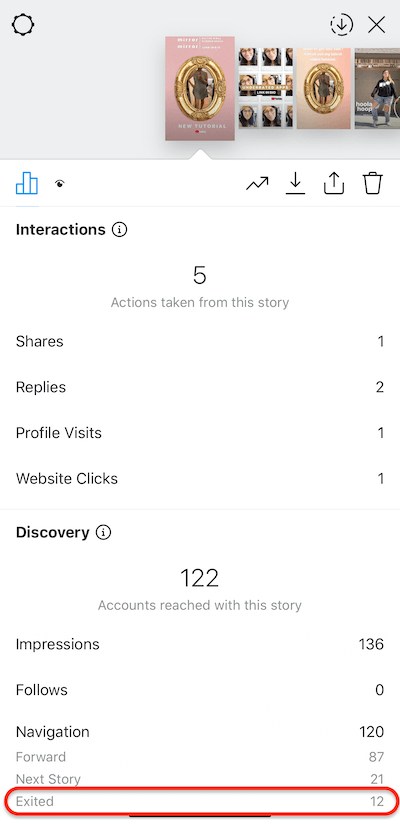
#4: Discover How Many People Exit the Instagram Story Feed From Your Story
Measuring your Instagram story exit rate helps you assess how many people left your story. An exit occurs when a person swipes down on the Instagram story slide or taps the X in the upper-right corner of the slide to close the Stories feed. These hard swipes/taps are a very deliberate action that users take so pay close attention to this metric. However, also note that it could mean the person needed to exit Instagram for another reason.
Story exits are bound to happen but if you evaluate your Instagram story series, you can start to identify which stories had a higher-than-average number of exits. Is there something you can learn from that? Perhaps you can apply a different approach in the future.

Discover Proven Marketing Strategies and Tips
Want to go even deeper with your marketing? Check out the Social Media Marketing Podcast! Publishing weekly since 2012, the Social Media Marketing Podcast helps you navigate the constantly changing marketing jungle, with expert interviews from marketing pros.
But don’t let the name fool you. This show is about a lot more than just social media marketing. With over 600 episodes and millions of downloads each year, this show has been a trusted source for marketers for well over a decade.
To calculate this metric, take the number of exits on a slide and divide it by the number of impressions.
number of exits / number of impressions = exit rate
For instance, if you had 2,200 impressions and 160 exits, your exit rate would be 7.2%.
Example: 160 / 2,200 = 0.072 x 100 = 7.2% exit rate
Identify What Content Works and What Turns Users Away
You might notice your exits happen in the first and last slide of your Instagram story series. Perhaps you could tweak your first slide to better entice users to keep watching. Analyze your exits to help improve your copywriting, visual aesthetic, and engagement (with question and poll stickers, animated video or text, and other optimizations).
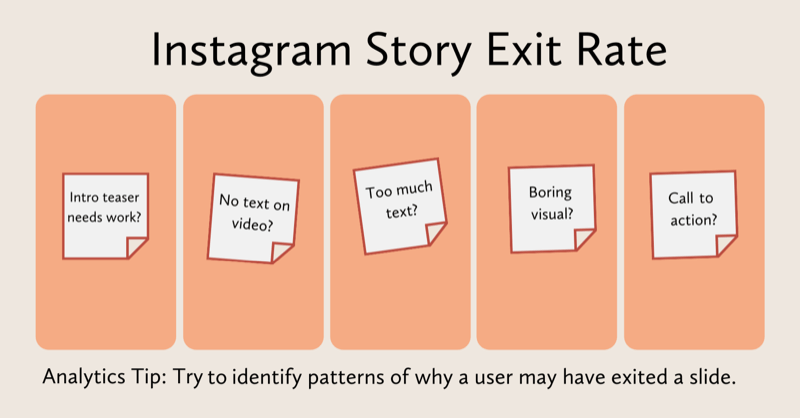
On your last slide, did you have a call to action (CTA)? Maybe people weren't interested in taking action and moved on. In this case, you could experiment with your CTAs by placing them in the middle of your story series instead of the last slide. When analyzing exit rates, see if you had a CTA, too much text on the slide, or other visuals that may have turned users off.
Exit vs. Next Story Metrics
The next story metric represents a hard swipe that takes viewers to the next account's story. It carries a more negative weight than exits because it means that person disengaged with your content and opted to move onto someone else's.
Find out where people are tapping to the next story to identify opportunities for improvement. For instance, if people are tapping to the next story at the beginning or end of your story, that could be an opportunity to improve your introduction, CTA, or engagement tactics for your audience.
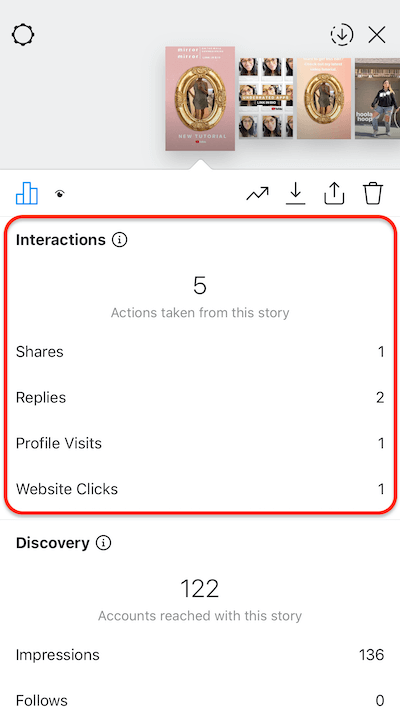
#5: See How Many Actions People Took on Your Instagram Story
Instagram Stories lets you measure the actions people took when they engaged with your story such as shares, replies, profile visits, website clicks, sticker taps (hashtag, location, @mention, and product), and link clicks (swipe-ups). If you have an Instagram business account with more than 10,000 followers, you'll have access to the Swipe-Up feature for links.
Measuring your engagement rate on Instagram Stories is essential to building an engaged community on the platform. Incorporate polls, ask questions, and encourage your followers to share their feedback or questions with you and sprinkle these interactions throughout your slides.
To measure your engagement rate, take the total number of interactions you received and divide it by the number of impressions.
interactions / impressions = engagement rate
If you had 1,900 impressions and 96 interactions, for example, your engagement rate would be 5%.
Example: 96 / 1,900 = 0.05 x 100 = 5% engagement rate
Look for Unique Elements That Boosted Engagement
Be mindful that impressions and interactions will fluctuate from slide to slide in an Instagram story series. That's why it's important to examine whether there was something unique on that slide that could have boosted the engagement rate, such as interactive stickers, a video, text overlay on the slide, and so on.
Identify what could have contributed to a higher or lower engagement rate on a slide to help improve future content.
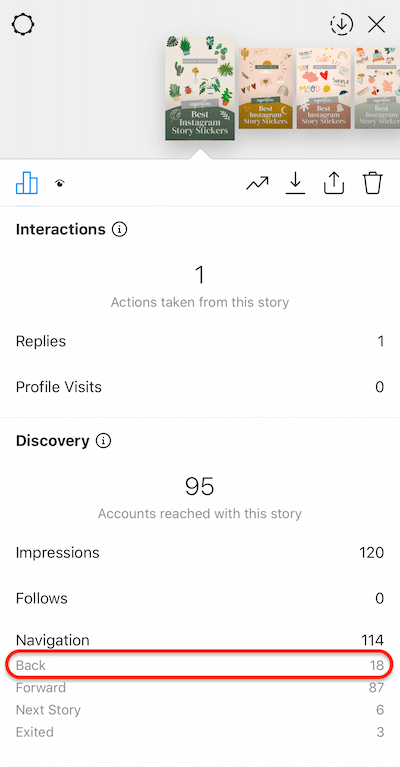
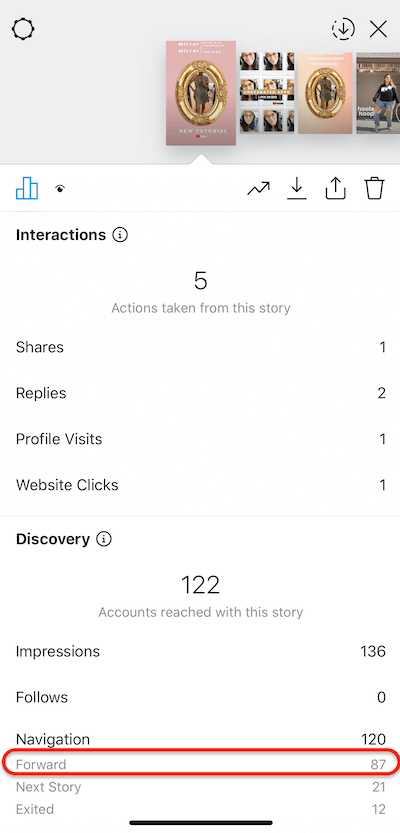
#6 and #7: Find Out How Often People Tap Back and Forward on Your Instagram Story
Taps back is the number of times viewers tapped back to repeat the previous photo or video in your Instagram story. Think of a tap back as a replay of your slide, which increases the total impressions on your story. While there may be several reasons why a user would do this, generally it means your slide had noteworthy information that required a second look. This metric is an indicator of sticky, quality content.
Taps forward is the number of taps to see the next photo or video in your Instagram story. If you have a series of back-to-back photos or creative tap-worthy content (i.e., stop motion frames or “tap to reveal” content), taps forward may make sense; however, a high number of taps forward in your story can also be a sign that your slides aren't very engaging.
Think of ideas for thumb-stopping content (a.k.a., taps back content). If you have too many videos or photos back to back, try adding a quiz, poll, or text on the slide to allow users to engage.
To measure your taps back rate, take the number of taps back you received and divide it by the number of impressions. You'll do the same to find your taps forward rate.
taps back / total number of impressions = taps back rate
Suppose you had 4,150 impressions and 275 taps back. Your taps back rate would be 6%.
Example: 275 / 4,150 = 0.06 x 100 = 6% taps back rate
Identify What Makes Users Tap Back and Replicate It
Between the two metrics, it's better to have a higher taps back rate than taps forward rate. Take note of what makes users tap back on content because it's a good indicator of what's working and can help influence future Instagram story content that will resonate with your audience.
Conclusion
These seven key Instagram story metrics can help you better understand how your audience is interacting with your content and inform future content. If you're feeling overwhelmed by analyzing all of the engagement metrics at once, focus on one at a time until you find what works for your content delivery and audience.
You could start with the Instagram story completion rate to help determine your optimal number of slides. Or you could explore your engagement rate and measure the number of replies you receive at the end of each story.
Perform an Instagram Stories content audit on a weekly or bi-weekly basis so you can gain insights quickly and apply actionable changes as you learn. Write down your observations, tactics, and insights as they trickle in. Once you have enough data to validate an editorial or engagement decision, move on to improving another engagement or growth metric.
What do you think? Which Instagram Stories metric are you trying to improve? Share your thoughts in the comments below.
More articles on marketing with Instagram Stories:
- Discover eight Instagram Stories hacks to give you a creative edge.
- Learn how to use Instagram stories to engage and guide people through your sales funnel.
- Find out how to create, set up, and run an Instagram Stories ad in Ads Manager.
Attention Agency Owners, Brand Marketers, and Consultants

Introducing the Marketing Agency Show–our newest podcast designed to explore the struggles of agency marketers.
Join show host and agency owner, Brooke Sellas, as she interviews agency marketers and digs deep into their biggest challenges. Explore topics like navigating rough economic times, leveraging AI, service diversification, client acquisition, and much more.
Just pull up your favorite podcast app, search for Marketing Agency Show and start listening. Or click the button below for more information.
