 The new social media reporting tools from Google Analytics provides marketers free social media monitoring and measurement capabilities.
The new reporting features provide the most value when coupled with Google+.
This way, community managers gain insight around off-page activity as Google Analytics and Google+ are happily integrated.
Tracking off-site social activity is just one of the cool new features that community managers will be swooning over.
Check out the other actionable reports outlined below and discover how businesses can best leverage them to determine the value of social media.
This article will cover how to use the new social reporting features inside Google Analytics to help evaluate and measure your social media campaigns.
#1: Social Visitors Flow
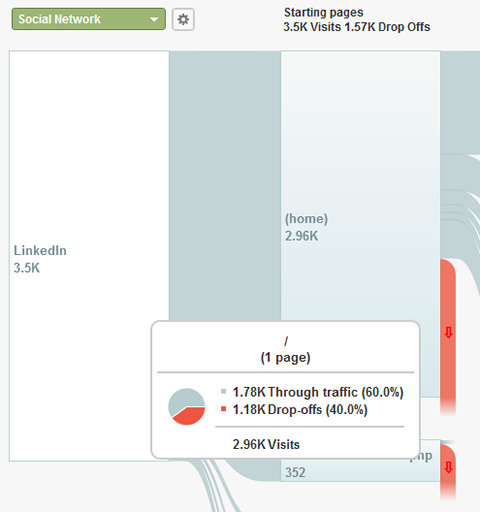
The newly added Social Visitors Flow is a visual presentation of how visitors from social properties are navigating your website. Assuming the goal of your social media campaign is to get more traffic to your website, this report quickly gives you insight into which social platforms are sending the most traffic to your site and what your social visitors are doing once they get there.
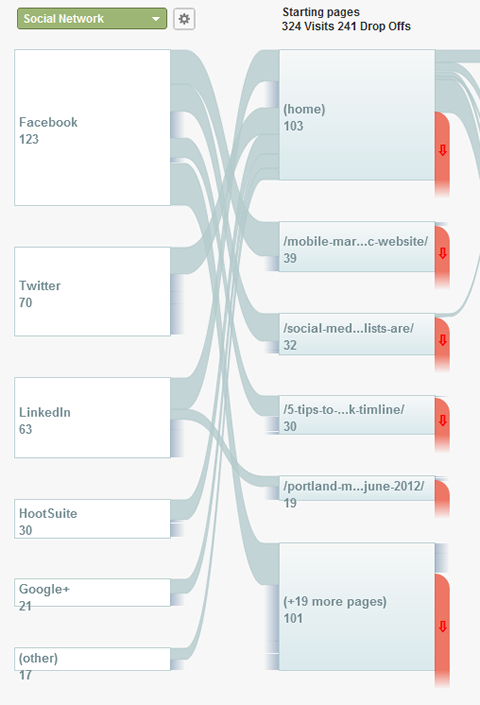
The chart outlines the top social referrers, the top landing pages and also the page drop-off rate. By comparing the drop-off rate of social traffic to other traffic sources, you can determine which traffic referrers are sending the most qualified visitors to your website.
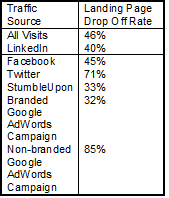
After spending a few minutes comparing this metric across the website's traffic channels, it's clear that visitors from LinkedIn and Facebook are spending more time on the website than visitors from a very expensive paid advertising campaign on Google AdWords.
“Having a comparison of the user drop-off rates across all channels is helpful in gaining a deeper understanding of what is working and what is not,” says Melissa Barker, author of Social Media Marketing: A Strategic Approach. “Knowing the number of visits each channel sent alone is not enough to gauge the true success of your messaging.”
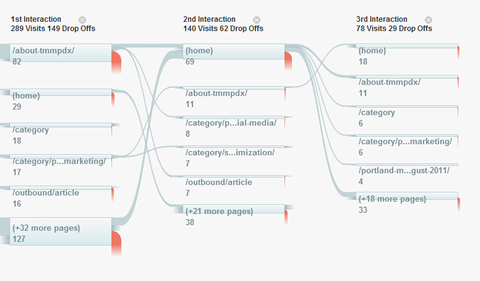
The Social Visitors Flow report also outlines a user's second, third, fourth and fifth interaction. By studying these interactions, you can quickly determine what visitors are looking for on your site and if they're headed down your conversion funnel.
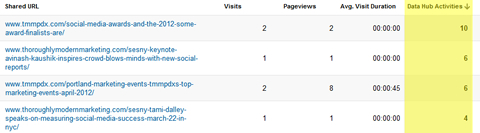
#2: Off-Site Activity—Social Data Hub
Google has partnered with several social networks to provide Google Analytics users with off-site activity data including +1s and comments. The full list of Social Data Hub partners can be found in the Google Developers forum, notable partners being Blogger, Disqus, Meetup, Google+, Digg, Delicious, Reddit and many more.
By navigating to your website's Social Sources in Google Analytics and then drilling down to the specific platforms supported by the Social Data Hub, you can gain insight into which specific pieces of content are driving the most social engagement.
Previously, this type of off-site data had been technically difficult and expensive to capture, requiring bulky third-party tools.
Get World-Class Marketing Training — All Year Long!
Are you facing doubt, uncertainty, or overwhelm? The Social Media Marketing Society can help.
Each month, you’ll receive training from trusted marketing experts, covering everything from AI to organic social marketing. When you join, you’ll also get immediate access to:
- A library of 100+ marketing trainings
- A community of like-minded marketers
- Monthly online community meetups
- Relevant news and trends updates
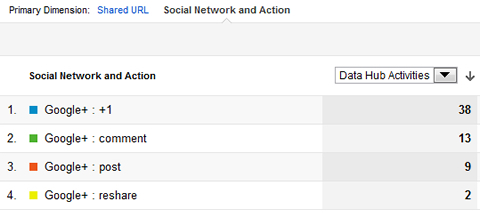
Google+ activity is fully integrated with Google Analytics and the off-site data for the platform is impressive. Businesses can discover the total number of +1s, comments, posts and shares on Google+, along with a breakdown of these metrics by individual post.
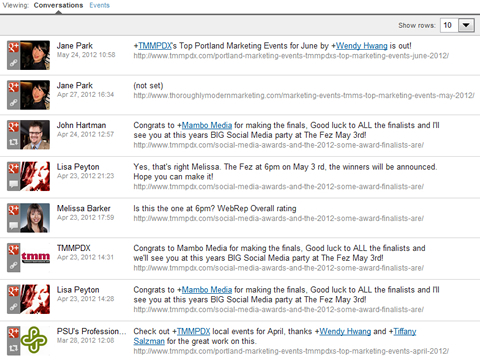
#3: Activity Stream
The Google Analytics Social Reports Activity Stream is REALLY cool! Granted, it would be way cooler if Facebook and Twitter were included in it, because then it would truly be an integrated reporting and monitoring platform for the most popular social channels.

Discover Proven Marketing Strategies and Tips
Want to go even deeper with your marketing? Check out the Social Media Marketing Podcast! Publishing weekly since 2012, the Social Media Marketing Podcast helps you navigate the constantly changing marketing jungle, with expert interviews from marketing pros.
But don’t let the name fool you. This show is about a lot more than just social media marketing. With over 600 episodes and millions of downloads each year, this show has been a trusted source for marketers for well over a decade.
This feature allows you to monitor some of the less obvious channels such as Digg, Read It Later, Echo, Delicious, etc. With the click of a button, you can see who has interacted with your content.
This feature is segmented by Conversations and Events. Conversations include content reshares, comments and new posts by anyone on the specific social network. Events include +1s, bookmarks, votes, saves, etc.
The Activity Stream allows you to view individual post/page analytics, the content on Google Ripples, the actual content and the social activity. With one click, you can jump to the interaction and respond, follow the user and monitor conversations about your content.
According to the Google Analytics team, the Activity Stream is REAL-TIME to the minute, so you'll see the most recent interactions and have the ability to respond immediately. This has been a long-standing issue with other monitoring platforms—they don't have the capability to give this type of insight in real time, when it's most relevant.
#4: Social Value At-a-Glance
Google's Social Overview report features a simple chart outlining what they call Social Value. In order to get the most out of this report, you'll need to set up “conversions” or GOALS within your Google Analytics account.
With only a few clicks, you can quickly start tracking how social traffic helps drive website conversions or events. This can include obvious conversions such as an online purchase or lead form completion, but it can also include micro-conversions such as video views or blog visits. Google allows you to define goals based upon a few factors:
- URL destination—For example, a user landing on a shopping cart or contact form thank-you page
- Visit duration—Based upon a specific amount of time spent on the website
- Pages visited—Based upon the number of pages visited on the site
- Event—Based upon user actions such as video views, white paper downloads or click-throughs
If you have defined a monetary value for your website conversion, you can enter that data when setting up the goal in Google Analytics. You are now armed with an actual dollar amount or Social Value for your social media channels.
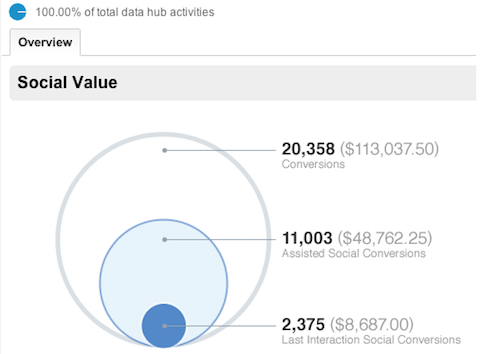
#5: Assisted vs. Last Interaction Analysis and the Multi-Channel Funnel Report
For years now, analysts have been discussing the limits of “last-click attribution” and the need for a more robust model to accurately measure online user behavior. If you are measuring your social media campaign effectiveness based upon the last-click model, you're likely underestimating the true impact of your campaigns.
Google Analytics has now made it easier than ever to detect which social channels have assisted with conversions by adding this option as a tab under the Social Conversions report. Google defines an assisted conversion as:
The number (and monetary value) of sales and conversions the social network assisted. An assist occurs when someone visits your site, leaves without converting, but returns later to convert during a subsequent visit. The higher these numbers, the more important the assist role of the social network.
As long as a user completes the conversion within 30 days, Google Analytics can track that conversion path from the first click to the final click and everywhere in between. They have presented this data visually in the Multi-Channel Funnel report. Simply navigate to Conversions and then click on Multi-Channel Funnels.
With one click, you can determine which channels are assisting with the most conversions and determine the top conversion paths.
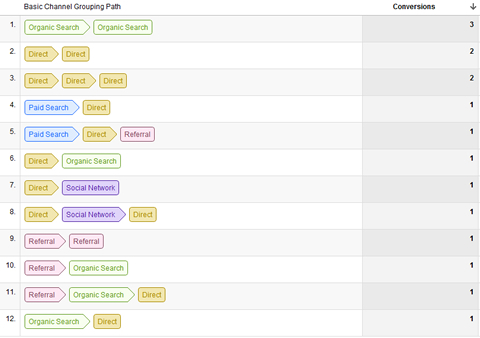
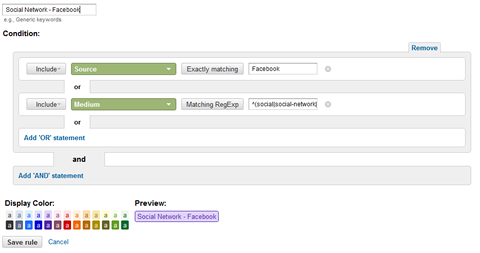
Google Analytics offers up to eight basic channel groupings, including one for all social channels as the default. But with only a few clicks, it's possible to customize these groupings to get even more detailed reporting.
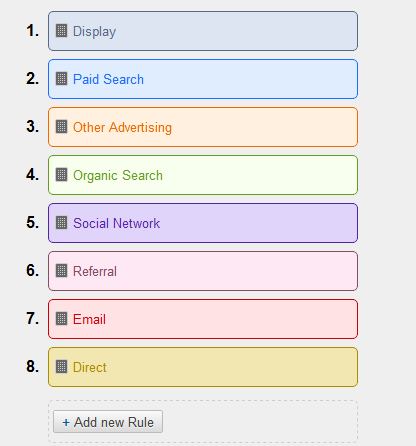
For example, I can create separate groupings for Facebook, Twitter and LinkedIn, thereby quickly determining which social campaign was assisting with the most conversions and driving the highest ROI.
These are just a sample of the actionable insights that can be gained from Google Analytics' new Social Reports.
The social reporting features combined with the power of Google Analytics and Google+ provide what social media marketers have been dreaming about—a seamless way to track the value of social media from the off-site social network activity to that final click on your website's Buy Now button.
What do you think? How are you using Google Analytics to help determine the value of your social media campaigns? Be sure to comment with your best reporting and measurement tips.
Attention Agency Owners, Brand Marketers, and Consultants

Introducing the Marketing Agency Show–our newest podcast designed to explore the struggles of agency marketers.
Join show host and agency owner, Brooke Sellas, as she interviews agency marketers and digs deep into their biggest challenges. Explore topics like navigating rough economic times, leveraging AI, service diversification, client acquisition, and much more.
Just pull up your favorite podcast app, search for Marketing Agency Show and start listening. Or click the button below for more information.
