
Do you want more from Google Analytics than standard reports?
Did you know you can get custom data?
Google Analytics lets you create custom segments, dashboards and reports to find the information that's most relevant to your business.
In this article I'm going to show you how to use these Google Analytics features.
#1: Custom Segments
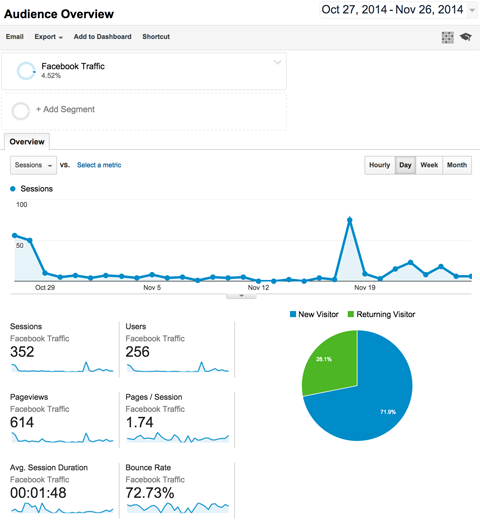
Segments let you isolate specific traffic throughout Google Analytics. For example, let's say that you want to learn about all of the traffic your website receives from Facebook. You can do that using a segment.
How to Set Up a Custom Segment
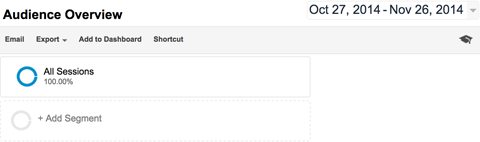
To get started, go to your website's profile in Google Analytics. Under the title of any standard report, such as the Audience Overview, there's an option to Add Segment.
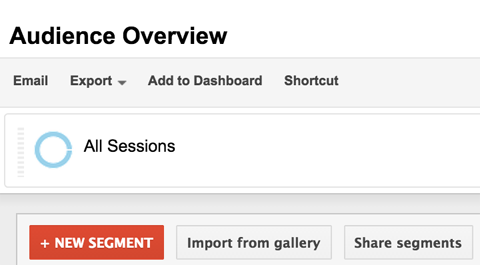
When you click on Add Segment, you're able to see all of your current segments and the red New Segment button.
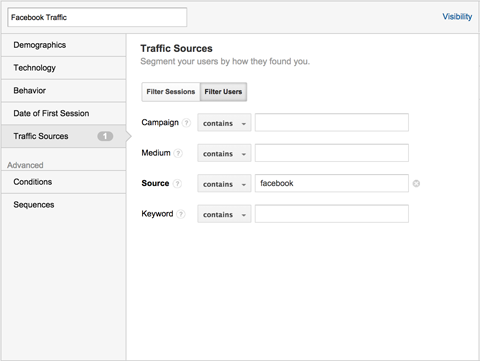
To create your segment, click the New Segment button and give it a name you'll recognize, such as Facebook Traffic. Then click on the Traffic Sources tab, and in the Source field, enter ‘facebook'. It should look like this when you're finished.
Click the Preview button to see if your segment finds traffic based on the configuration you've created, which in this case is traffic from Facebook. If it does, click Save and it's automatically applied to your Google Analytics view.
Now you can continue to click through all of your standard reports, such as the Audience Overview, and see data specifically related to your Facebook Traffic segment.
Using Custom Segments
Get World-Class Marketing Training — All Year Long!
Are you facing doubt, uncertainty, or overwhelm? The Social Media Marketing Society can help.
Each month, you’ll receive training from trusted marketing experts, covering everything from AI to organic social marketing. When you join, you’ll also get immediate access to:
- A library of 100+ marketing trainings
- A community of like-minded marketers
- Monthly online community meetups
- Relevant news and trends updates
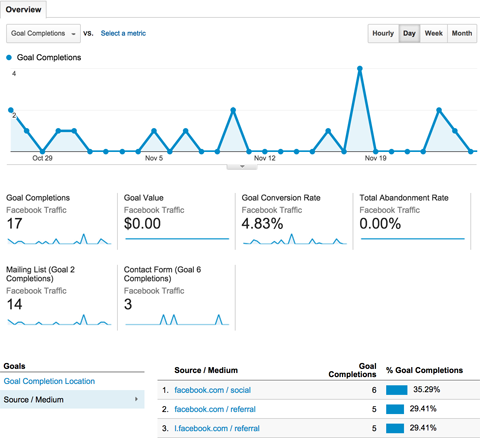
Here are a few examples of the data analyses you can do with segments:
- See the geographic location of your Facebook traffic with the Audience > Geo > Location report.
- Distinguish the specific sources of your Facebook traffic (mobile versus desktop) with the Acquisition > All Traffic report.
- Find out what content your Facebook traffic likes the most with the Behavior > Site Content > All Pages report.
- Discover how well your Facebook traffic converts toward specific goals with the Conversions > Goals > Overview report.
You can also compare traffic from different segments.
Let's say you want to look at all of your reports to see the differences between your Facebook and Twitter traffic. Using the steps outlined above, set up a Twitter Traffic segment.
Next, make sure you have both segments selected at the top of your reports. You will then be able to see all of the data in your standard reports with Facebook Traffic highlighted in one color and Twitter Traffic highlighted in another.
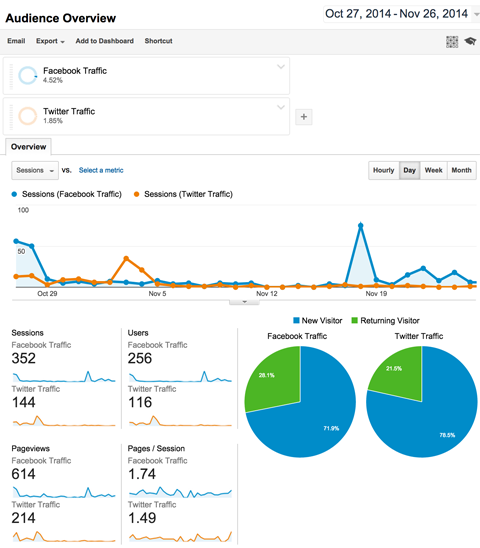
Now you can go through all of your reports to see the differences in both sources of traffic.
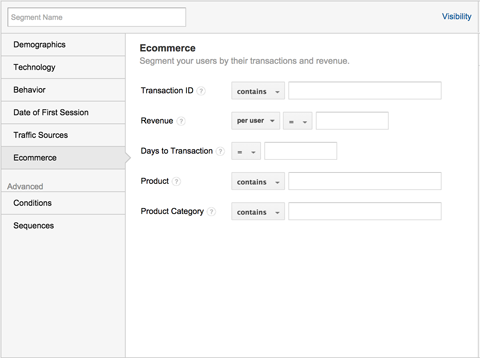
In addition to isolating traffic from specific sources, you can set up segments to see traffic:
- From specific demographics
- From users with specific technology
- With specific behavior
- That completes specific ecommerce purchases
And you can set up segments using any other dimensions or metrics you choose.
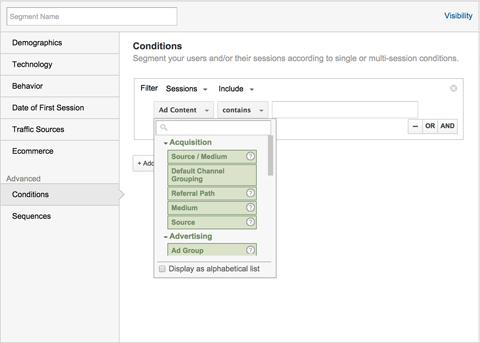
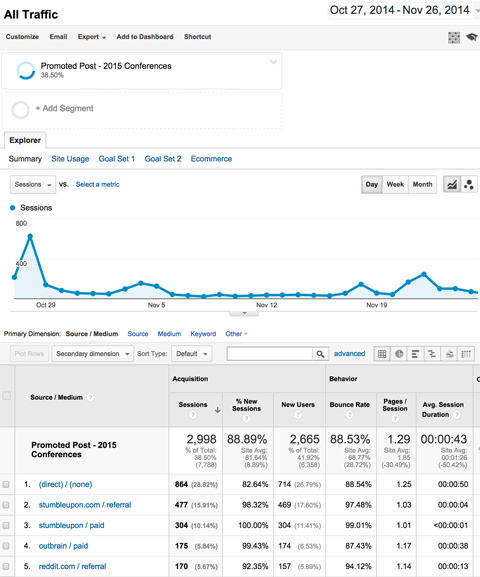
For example, publishers that want to isolate the traffic of one particular article can set up an Advanced Conditions segment using the Behavior > Page dimension and entering the URL of the article in the field.
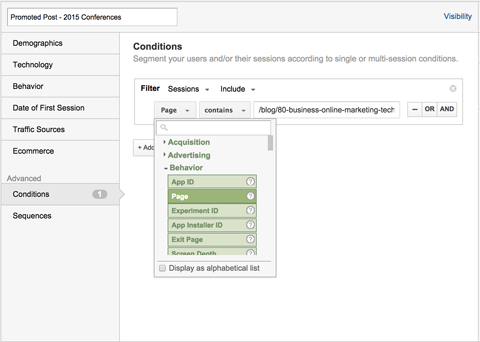
Now you can view all Google Analytics data for a particular article, from demographics to conversions.
You can configure multiple dimensions and metrics in one segment, so if you want to isolate Facebook traffic from the United States representing females in the 18-24 age group in one segment, you can.
Or if you want to isolate all of the traffic from the top social media networks in one segment and all of the traffic from the top search engines in another segment to compare them, you can. The possibilities are endless.
#2: Custom Reports
Instead of relying on the standard reports provided by Google Analytics, you can simply create your own to show the data you're interested in.
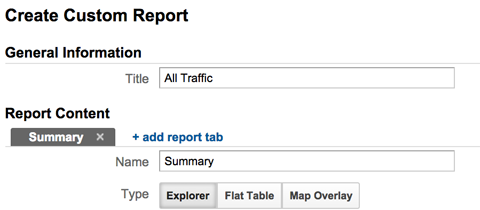
How to Set Up a Custom Report
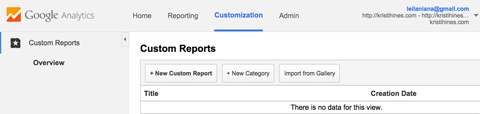
You can find custom reports in the Customization menu at the top of Google Analytics.
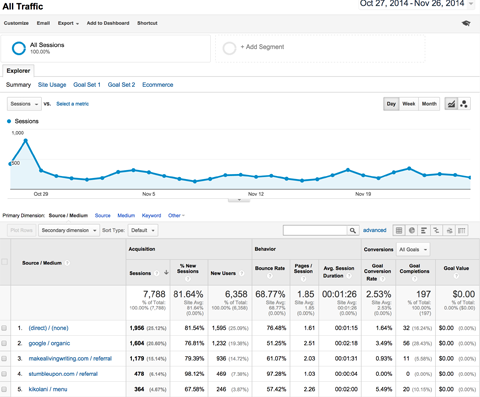
The easiest way to understand how to create a custom report is to first understand the basics of creating a standard report. Let's take the Acquisition > All Traffic report as a base.
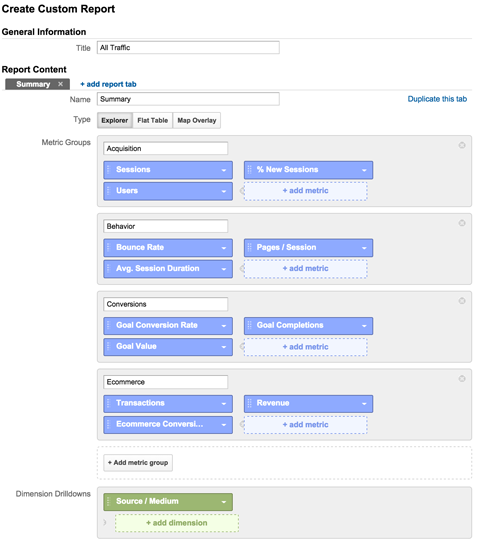
To create a custom report that mimics the All Traffic report, start by giving the report the title All Traffic. Then rename the first report tab Summary and select Explorer as the report type. This gives you the graph at the top of the report and table at the bottom.
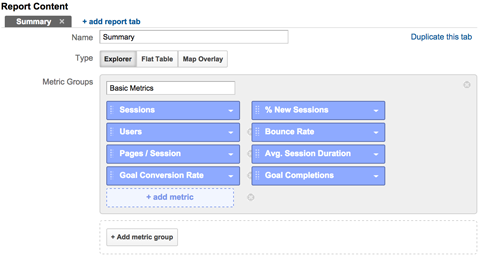
Name the first metric group Basic Metrics. Click the Add Metric button to add Sessions, % New Sessions, Users, Bounce Rate, Pages / Session, Avg. Session Duration, Goal Conversion Rate, Goal Completions and Goal Value as metrics. If you start by typing the names in the search box, you'll find each metric quickly.
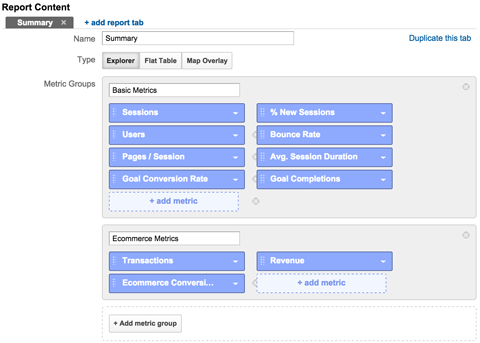
Click the Add Metric Group button to add a second metric group and name it Ecommerce. Then click the Add Metric button to add Transactions, Revenue and Ecommerce Conversion Rate as metrics for the Ecommerce metric group.

Discover Proven Marketing Strategies and Tips
Want to go even deeper with your marketing? Check out the Social Media Marketing Podcast! Publishing weekly since 2012, the Social Media Marketing Podcast helps you navigate the constantly changing marketing jungle, with expert interviews from marketing pros.
But don’t let the name fool you. This show is about a lot more than just social media marketing. With over 600 episodes and millions of downloads each year, this show has been a trusted source for marketers for well over a decade.
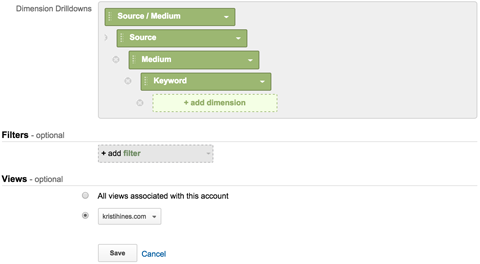
Next, by Dimension Drilldowns, click the Add Dimension button to add Source/Medium.
Continue clicking the Add Dimension button to add Source, Medium and Keyword. Once you're finished, click the Save button.
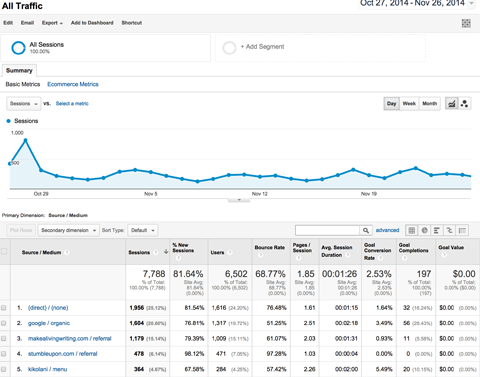
You will then be taken to a new custom report similar to the standard All Traffic report.
Using Custom Reports
Now that you have a good feel for what will go where in a custom report, you can create any report you choose.
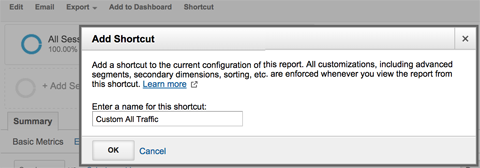
After you create your reports, you can use the Shortcut option in the menu under the report name to create a shortcut to access your custom report in the left sidebar of Google Analytics.
You can use the Export option in the menu under the report name to download your custom report in a format of your choosing.
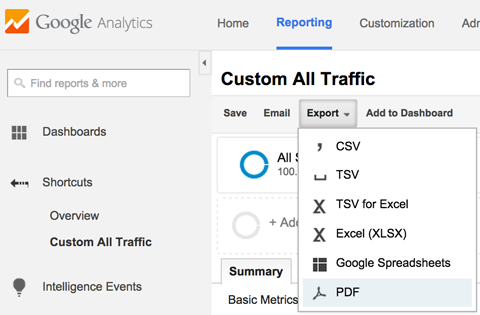
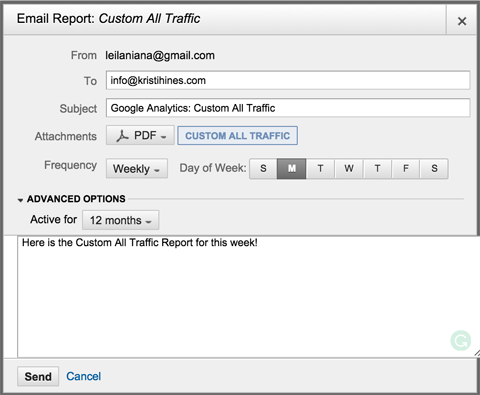
The Email option in the menu under the report name lets you email the custom report to a specific email address in the format of your choosing once or on a regular basis.
#3: Custom Dashboards
If you prefer viewing your Google Analytics data in a dashboard, you can create custom dashboards full of widgets with specific Google Analytics data. This way, you get the data you want, exactly how you want it.
How to Create Custom Dashboards
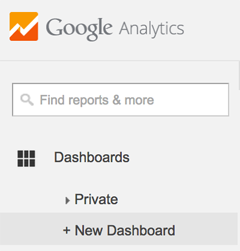
To create your custom dashboard, click on the New Dashboard link under Dashboards in the left sidebar menu of Google Analytics (above your standard reports menu items).
You will have the option to create a Blank Canvas (empty) dashboard or a Starter Dashboard with example widgets.
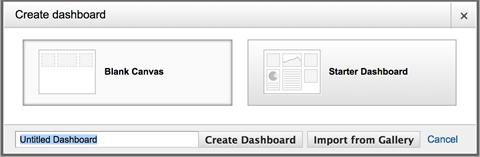
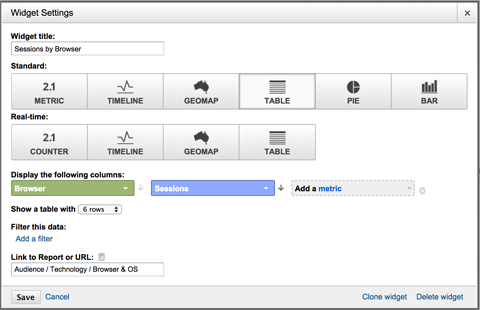
Begin with the Starter Dashboard. This will give you some widgets to experiment with. You can hover over each of the widgets and click the pencil icon to edit them.
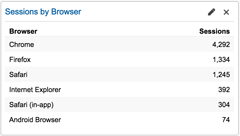
This will allow you to see how each of the widget types are created.
As you can see, you can create custom widgets in different formats to pull normal data, as well as real-time visitor data. You can add specific dimensions and metrics based on the widget format you have chosen and even link it to standard or custom reports within Google Analytics for more information.
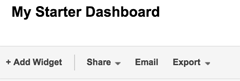
From here, you can modify widgets in your Starter Dashboard or begin to create your own widgets in a new Blank Canvas dashboard using the Add Widget button in the menu below your dashboard name.
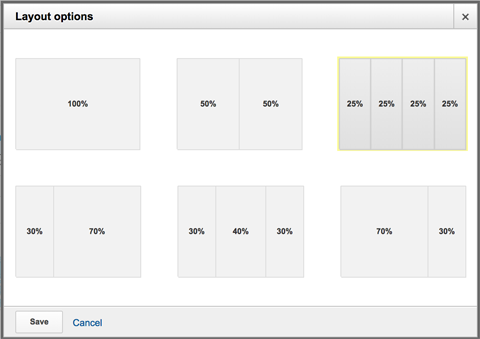
You can also format your dashboard's column layout using the Customize Dashboard menu item.
Experiment with different formats and data until you find the perfect collection of dashboards that give you all of the data you want on one screen.
Using Custom Dashboards
Similar to custom reports, you have the option to export your dashboard as a PDF and have it emailed to you on a regular basis.
You can use this option to email standard dashboard data, as well as real-time dashboards, to yourself on a daily or weekly basis.
Bonus Tip: Third-Party Dashboards
The one thing you can't do with Google Analytics dashboards is see data from more than one website in one dashboard at a time. If you own or manage multiple websites, having a dashboard with basic Google Analytics data for all of those websites is a huge timesaver.
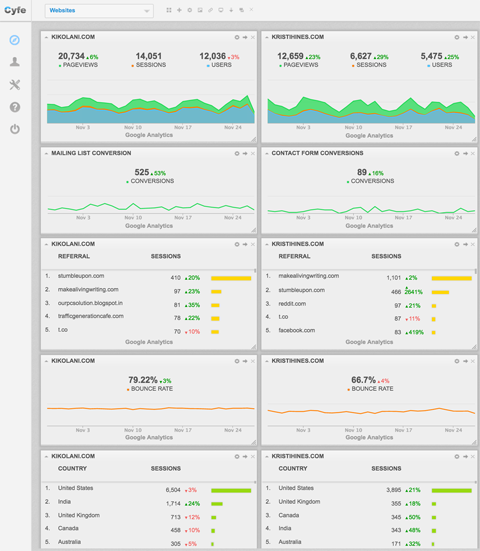
To accomplish this, use a third-party tool called Cyfe to create a Google Analytics dashboard with data from all of your websites on one screen. For example, you can create a block of overview widgets that shows your pageviews, sessions and users.
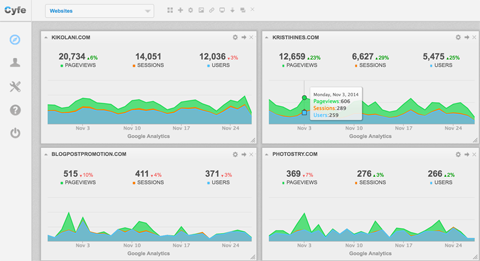
You can also create columns of widgets with important Google Analytics data for each website.
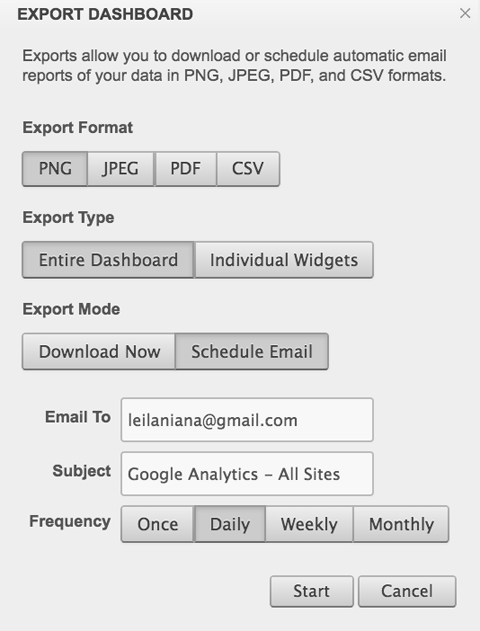
You can even set up reports to be emailed to you on a regular basis with all of your Google Analytics widgets for your websites.
This is a great option if you have multiple websites or want to view your Google Analytics data alongside widgets with social media and other business data.
How to Get More Custom Segments, Reports and Dashboards
The Google Analytics Solution Gallery is full of custom segments, reports and dashboards created by other Google Analytics users. To view them, click the Import from Gallery button in the Segments, Reports and Dashboards sections of Google Analytics.
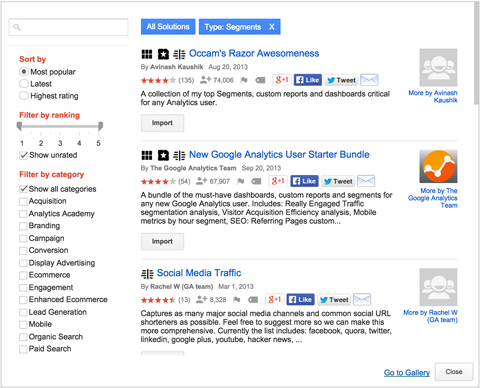
You can filter segments, reports and dashboards by category from Acquisition to Paid Search or use the search box to find segments by keyword. When you find one you want, click the Import button beneath it to add it to your own Google Analytics account.
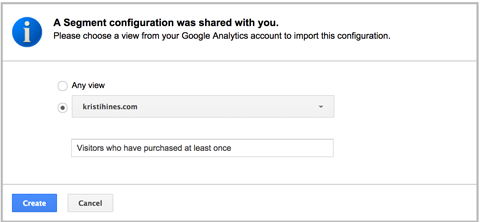
Likewise, there's also an option to share a link to your custom asset with someone else directly or have your asset added to the Google Analytics Solutions Gallery.
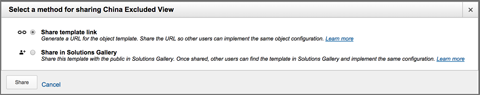
Note that when you share a segment, report or dashboard, you share the structure only. Rest assured no one will receive your actual Google Analytics data when you do this.
Conclusion
Google Analytics has many features beyond its standard reports to help you see your website analytics in a whole new light. The tips above can help you slice and dice your data with custom segments, reports and dashboards to learn even more about your traffic.
What do you think? Do you use segments, reports and dashboards in Google Analytics? What are your favorites? Please share in the comments!
Attention Agency Owners, Brand Marketers, and Consultants

Introducing the Marketing Agency Show–our newest podcast designed to explore the struggles of agency marketers.
Join show host and agency owner, Brooke Sellas, as she interviews agency marketers and digs deep into their biggest challenges. Explore topics like navigating rough economic times, leveraging AI, service diversification, client acquisition, and much more.
Just pull up your favorite podcast app, search for Marketing Agency Show and start listening. Or click the button below for more information.
