 Are you taking advantage of the actionable data Facebook offers marketers?
Have you explored the Facebook Analytics dashboard?
Facebook Analytics is a robust tool that lets marketers explore users' interactions with advanced goal paths and sales funnels for Facebook ads.
In this article, you'll discover how to get started with Facebook Analytics.
What Data Is Available in Facebook Analytics
While Facebook Analytics is a free tool, it's designed to work with Facebook Ads which do have a cost attached to them.
Previously, Facebook allowed you to see only the last touch point in your funnels. For example, if someone interacted with seven of your posts but purchased on the eighth interaction, only the final interaction would be given credit for the conversion.
Now you can see the full interaction path to the conversion, rather than just the last touch point.
Overall, the Facebook Analytics update added these features:
- Advanced machine learning/AI capabilities to display important insights, such as which audiences are most often engaging with or converting from your content
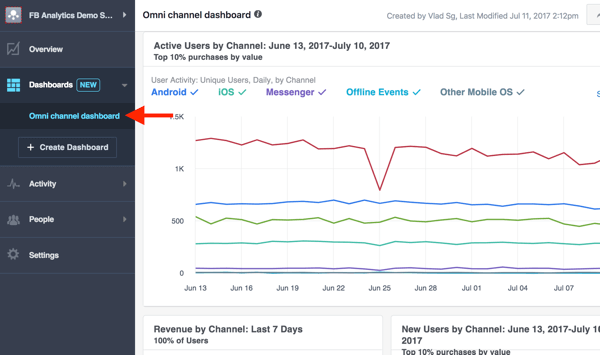
- Omni-channel analytics so you can view users who hopped from the Facebook app to your app to your website back to Facebook on desktop before converting
- Custom dashboards so you can see important data at a glance
- The ability to build custom audiences based on omni-channel insights
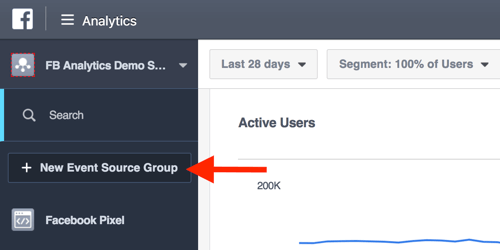
- The ability to create event source groups from the dashboard, allowing you to segment and retarget people who followed a specific event path on your page
The redesigned Facebook Analytics is one of the most significant updates since the massive algorithm change. Now let's look at how to navigate the analytics interface to find the information that matters most to you.
#1: Access Your Facebook Analytics
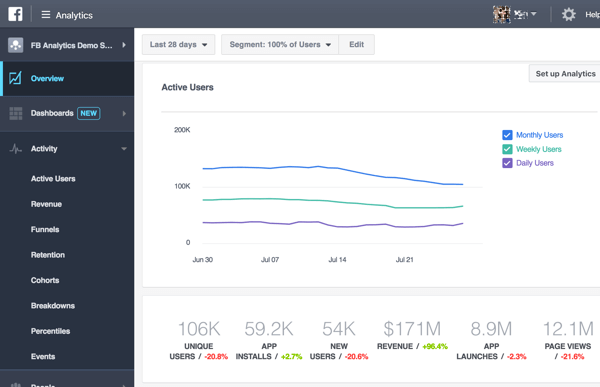
To get started, navigate to your Facebook Analytics dashboard. Note: For this dashboard to work, you need to install the Facebook pixel. Once you've installed it and given it time to run, your dashboard will populate with all of your analytics data.
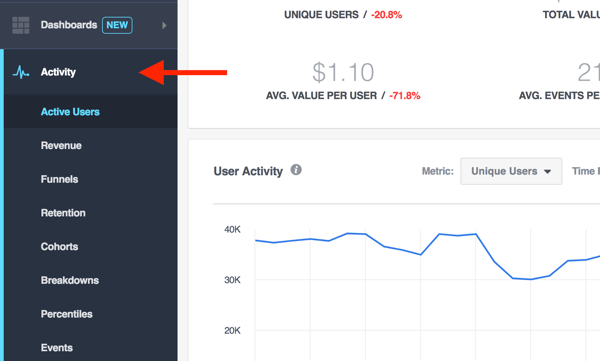
When you first open your analytics dashboard, you'll see an overview of your analytics. Click Dashboards in the left sidebar to view your omni-channel and custom dashboards.
Click Activity to delve into analytics specific to active users, purchases, funnels, and more.
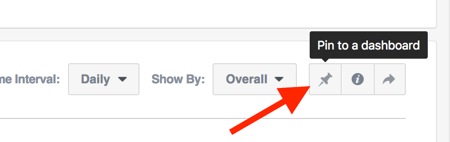
As you explore your data, you can add relevant charts to a custom dashboard for easy access. To pin data to a dashboard, click the Pin to a Dashboard icon in the upper-right corner of the chart.
Get World-Class Marketing Training — All Year Long!
Are you facing doubt, uncertainty, or overwhelm? The Social Media Marketing Society can help.
Each month, you’ll receive training from trusted marketing experts, covering everything from AI to organic social marketing. When you join, you’ll also get immediate access to:
- A library of 100+ marketing trainings
- A community of like-minded marketers
- Monthly online community meetups
- Relevant news and trends updates
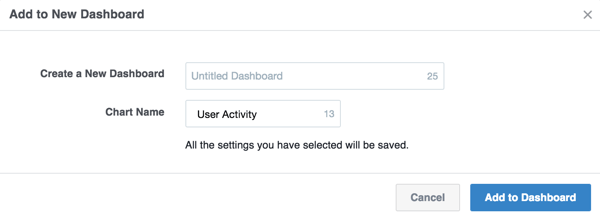
In the pop-up box, create a new dashboard (or select an existing dashboard if you already have one). Then enter a name for your chart and click Add to Dashboard.
#2: Review Activity Reports
Reports are the bread and butter of analytics software. They allow you to understand the data better based on specific needs so you can make more informed decisions.
Facebook's updated analytics dashboard has extensive reporting capabilities. You can drill deeply into your data, looking at micro-conversions mixed with several demographics and events.

Discover Proven Marketing Strategies and Tips
Want to go even deeper with your marketing? Check out the Social Media Marketing Podcast! Publishing weekly since 2012, the Social Media Marketing Podcast helps you navigate the constantly changing marketing jungle, with expert interviews from marketing pros.
But don’t let the name fool you. This show is about a lot more than just social media marketing. With over 600 episodes and millions of downloads each year, this show has been a trusted source for marketers for well over a decade.
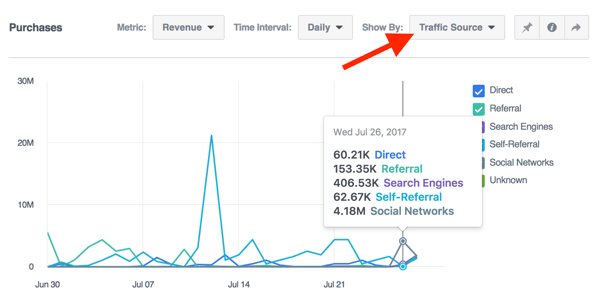
To illustrate, let's say you own an ecommerce store and want to find out which customers are converting best from Facebook. Choose Activity > Revenue to generate a report of purchase-related data.
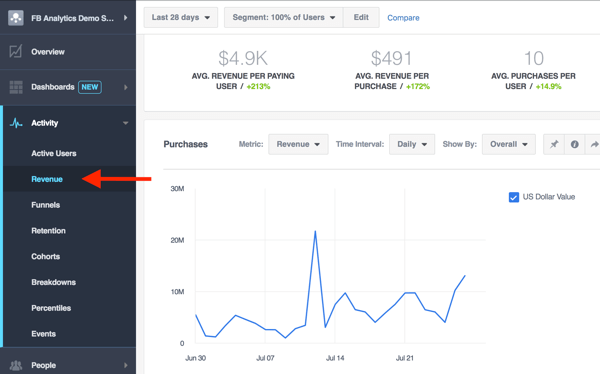
To narrow the data, select an option from the Show By drop-down menu.
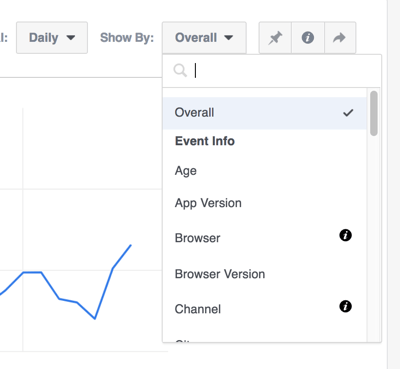
For instance, select Traffic Source to look at conversions based on traffic source.
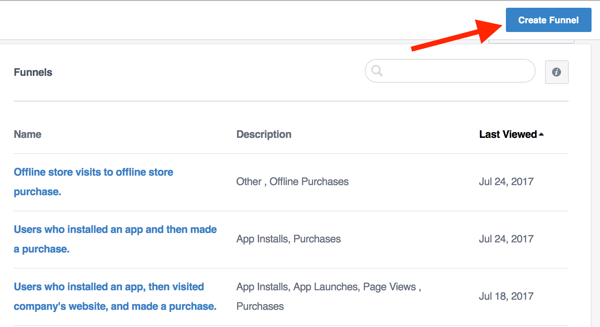
What's really cool is that you can create cross-channel funnels to test which interaction paths have the highest conversion rates. To create a funnel, go to Activity > Funnels and click Create Funnel in the upper-right corner of the page.
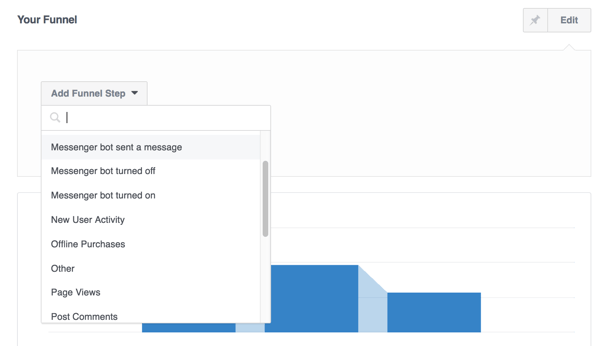
Some funnel examples include:
- Users who messaged your Facebook page and then made a purchase on your website
- Users who installed an app and then made a purchase on your website
- Users who reacted a certain way (such as Love, Wow!, or Haha) and then made a purchase
- Users who commented on a certain Facebook post and then made a purchase
As you can see, your funnels can be really detailed. They can be as simple or complex as you want to make them.
#3: Use Facebook Analytics Data to Inform Your Campaigns
The real value of Facebook Analytics is how you use the data to make informed decisions for your business. It's important to understand that even if a Facebook ad campaign isn't converting well, it may still be having a positive effect on your bottom line. These insights can help you see that.
For instance, suppose that one of your campaigns gets people to click but not convert. From there, people may interact with another retargeting campaign that's converting well. Remember that without the initial campaign, you wouldn't get the first touch point that arguably led to the final conversion.
So how do you use this data to your advantage? One way is to see which funnels are converting best and then push to get more people through those funnels.
For example, if you notice that most people convert after messaging you on Facebook, you can use Messenger chatbots to automatically engage with anyone who likes your page. Or if you notice people convert better after commenting, do more to encourage comments such as posting questions for your audience to answer.
These ideas just scratch the surface of what's possible. If you're creative, you can use analytics data to inform almost every decision you make, such as:
- Which audience to target
- Where to place your ads
- Which channel to drive traffic to
- What type of content to post
Take some time to really explore your Facebook Analytics. Examine the reports in detail, try new combinations of funnels, and target different audiences to harvest more data to play with. The more time you spend on your analytics, the better you'll understand the breadth of data available.
Want more like this? Explore Facebook Ads for Business!
.
Conclusion
If you want to get the most from your social media marketing, understanding your Facebook analytics data is a must. With this data, you can maximize your engagement and conversions, and get better results from your marketing efforts.
What do you think? How will you use Facebook's new Analytics platform to enhance your social media presence? Let me know in the comments below!
Attention Agency Owners, Brand Marketers, and Consultants

Introducing the Marketing Agency Show–our newest podcast designed to explore the struggles of agency marketers.
Join show host and agency owner, Brooke Sellas, as she interviews agency marketers and digs deep into their biggest challenges. Explore topics like navigating rough economic times, leveraging AI, service diversification, client acquisition, and much more.
Just pull up your favorite podcast app, search for Marketing Agency Show and start listening. Or click the button below for more information.
