 Are you looking for a way to analyze the impact of your content?
Do you need a simple system that works?
If you don't have the budget for expensive software, spreadsheets and a little of your time can produce some useful data.
In this article I'll show you how to analyze the engagement and impact of your social media posts using Excel.
Why Analyze?
No matter the size of your business, when it comes to social media you want to build two things: engagement and community.
To ensure that you deliver great content that resonates with your fans and followers, you need to track, test and measure the posts you put on your social networks.
It's really that simple.
Here's how:
#1: Build Your Spreadsheet
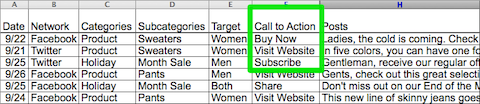
To begin, open Excel and create 14 columns that will contain the following categories to incorporate all of the information you need on your social media updates and posts:
- Date
- Network
- Categories
- Subcategories
- Target
- Calls to action
- Meta-tags
- Posts
- Impressions
- Comments (replies)
- Likes (favorites)
- Shares (retweets)
- Clicks
- Total engagement

The last four columns are where you store the engagement numbers for your content. Every network has three basic engagement actions: like, comment and share. Even on Instagram, which does not have a repost function built into it, there's user behavior of reposting and tagging the original author.
Use this spreadsheet to store data and analyze your content.
#2: Identify Categories and Subcategories
You'll need to decide on the information below and make a note of it before moving on to step #4 below where you fill in the spreadsheet.
Categories
Get World-Class Marketing Training — All Year Long!
Are you facing doubt, uncertainty, or overwhelm? The Social Media Marketing Society can help.
Each month, you’ll receive training from trusted marketing experts, covering everything from AI to organic social marketing. When you join, you’ll also get immediate access to:
- A library of 100+ marketing trainings
- A community of like-minded marketers
- Monthly online community meetups
- Relevant news and trends updates
Base your categories on the major topics of your posts and use them to identify major trends in content performance across each network. Examples of categories are:
- Product: Posts about major product categories.
- Holiday/seasonal: Posts with seasonal themes, which are especially helpful for e-commerce businesses.
- Third-party content: Posts with content from other websites such as news, articles and blog posts.
Create as many categories as you like, but keep them manageable and general. Save the specifics for subcategories.
Subcategories
Break down categories into smaller subcategories. This enables you to identify microtrends, as well as which pieces of content work the best and the worst. Based on the categories above, examples could include:
- Specific product names or features.
- Specific names of holidays or campaigns you're running for a particular season.
- Specific website names from which you pull content or categories of topics for articles such as “humor,” “lifestyle” or “beauty.”
Subcategories can be as specific as you like, but keep them thematic. Each subcategory should have at least three posts; otherwise it may be too specific and better suited as a meta-tag (more on that later).

#3: Outline Your Targets and Calls to Action
These two columns require the most forethought and a good understanding of your target market and business goals. You'll need this information to fill out these columns on your spreadsheet.
Target
The target is whom you're speaking to with your content. Your business may have multiple targets based on the people and decision-makers who engage with your content and purchase your products. For the sake of simplicity, we will use “male” and “female” as target examples.
However, I encourage you to spend time considering the different types of people in your audience and build context around those individuals to inform your content strategy.
Calls to Action
CTAs take many forms, depending on the individual goals of the post in each category. Just keep in mind that not all posts need CTAs and not all CTAs must be related to products.

Discover Proven Marketing Strategies and Tips
Want to go even deeper with your marketing? Check out the Social Media Marketing Podcast! Publishing weekly since 2012, the Social Media Marketing Podcast helps you navigate the constantly changing marketing jungle, with expert interviews from marketing pros.
But don’t let the name fool you. This show is about a lot more than just social media marketing. With over 600 episodes and millions of downloads each year, this show has been a trusted source for marketers for well over a decade.
Examples of CTAs include:
- Subscribe
- Visit website
- Buy now
- Share
Meta-tags
For a much deeper analysis on your types of content, you should use additional meta-tags to describe the individual elements of the content itself.
Keywords, image descriptions (such as person, object, colors, size or orientation) and even tone descriptors for the copy (such as humorous or excited) can be used as meta-tags.
These tags help isolate trends in creative content so you can select more engaging images and write more dynamic copy for your posts.
#4: Collect Your Data
Time to fill in your spreadsheet! There are a number of ways to do this, depending on the networks you use.
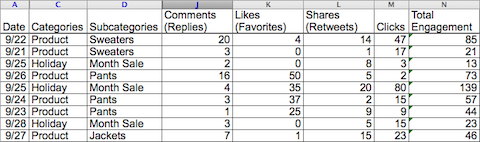
Below is an example of a spreadsheet for a retail company using the above-defined categories, subcategories, targets and meta-tags.
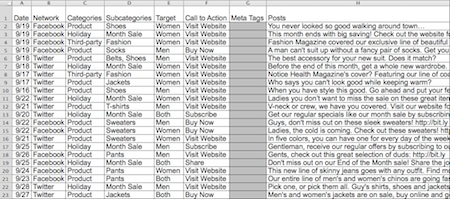
There's a lot of information to gather, but it's all easy to find.
Twitter Analytics has an Export feature for your last 500 tweets, and Facebook Insights can be exported in 180-day chunks. Export regularly to make sure your data is current.
Use a tool like bit.ly to keep track of your link clicks. If you tend to post the same link multiple times, make sure you're attributing your click to the right content by using tools like HootSuite‘s Click Report or BufferApp to track which specific posts generate the clicks. Each of these tools has free versions that allow you to measure posts on multiple networks.
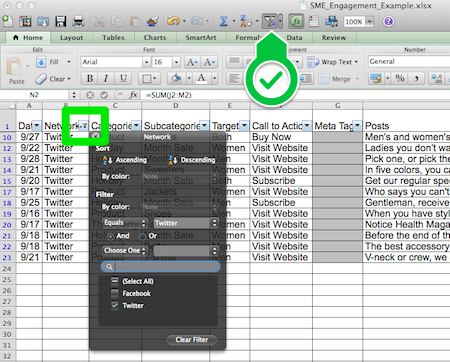
#5: Sort Your Data
To identify your best-performing content across all of your networks, sort the Total Engagement column in descending order.
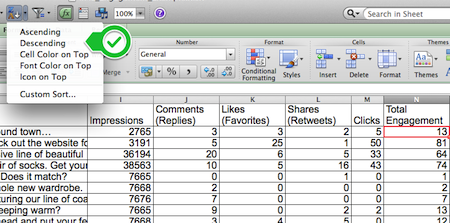
The best-performing posts in terms of engagement show at the top of the column.
To find the best-performing posts for specific social networks like Twitter or Instagram, filter first by Network, then by Total Engagement.
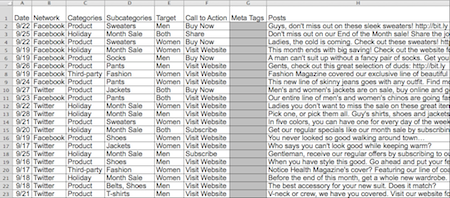
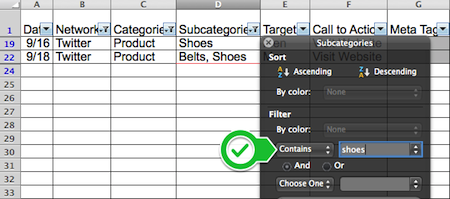
#6: Analyze Categories
The next step is to manually filter for the categories and subcategories you're interested in reviewing.
Excel is very literal, so if you include more than one category or subcategory assigned to content, you'll need to use the “contains” input in the Excel Filter feature, rather than selecting the check boxes. Use this setting to see the rows in the column that have multiple subcategories assigned, and those with just one.
Once you identify the top posts in your categories, it's time to analyze them for post copy, sentence structure and images (if applicable). What trends can help you optimize content for each network?
Here are examples of three posts that promoted the same link.
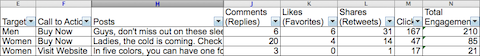
In this case, analysis shows that the shorter post lengths received more engagement. Among these similar posts about sweaters, the post using two different images generated a higher click-through rate with males than with females.
Conclusion
You don't have to rely on intuition to find out which posts perform best for you. Use Excel to reveal important insights about post engagement in nearly real time and make more informed decisions about your content strategy.
What do you think? How are you currently measuring the impact of your content? Do you have other strategies or tools that you use? Please leave your questions and comments in the box below.
Images from iStockPhoto.
Attention Agency Owners, Brand Marketers, and Consultants

Introducing the Marketing Agency Show–our newest podcast designed to explore the struggles of agency marketers.
Join show host and agency owner, Brooke Sellas, as she interviews agency marketers and digs deep into their biggest challenges. Explore topics like navigating rough economic times, leveraging AI, service diversification, client acquisition, and much more.
Just pull up your favorite podcast app, search for Marketing Agency Show and start listening. Or click the button below for more information.
