 Do you know where your customers and prospects spend time online?
Marketers have long relied on market research to determine where to spend their advertising dollars on television, radio and print advertisements.
In the last few years, research organizations have begun providing intelligence on how consumers behave on social networks.
The following article is based on new social media research studies.
These findings will help you better strategize your company's social efforts to match your customers' behaviors.
#1: Know Where Your Customers Spend Their Time
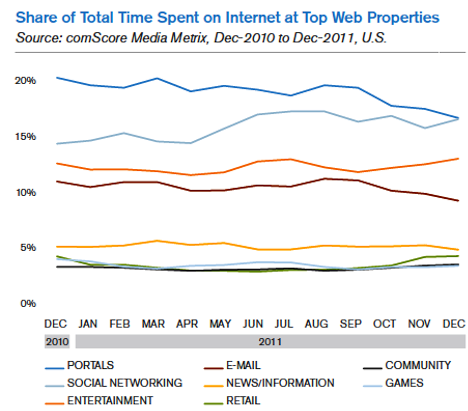
Three recent research studies show active Internet users spend anywhere from 16% to nearly 25% of their online time on social networks.
In comScore's 2012 U.S. Digital Future in Focus report, researchers found that 90% of all U.S. Internet users visited social networking sites in December 2011. Additionally, consumers are spending 1 out of every 6 online minutes on social networks (16.6%). That's up from less than 15% at the end of 2010.
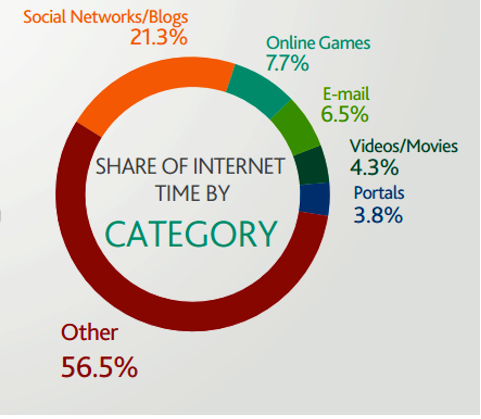
Nielsen recently released the State of the Media: U.S. Digital Consumption Report, Q3-Q4 2011. The study found Internet users spend 21.3% of their time on social networking sites. This report shows a much smaller percentage of time spent on Internet portals like Yahoo!
PQ Media found the average U.S. Internet user spends around 33 hours per month on the Internet and about 8 of those hours on social media.
These researchers didn't disclose their methodologies, so we can't explain why the results differ so dramatically, though I imagine it's due to how they defined some of their terms. That said, all three reports show an upward trend in the volume and percentage of time spent on social networks.
Key Lesson:
Your online customers are spending significant amounts of time on social networks. While the average person might only spend 15-30 minutes per day, many people spend multiple hours each week. Your strategic marketing plan should include a steady dose of social media along with email and other marketing strategies that reach your target audience.
#2: Find Content That Will Resonate Deeply With Your Audience
The comScore graphic above shows an upward trend in online entertainment consumption. Given the growing numbers of consumers ages 18-34 who watch videos and engage on social networks simultaneously, it is important for marketers to become skilled at engaging in conversations about hot cultural topics seen in the entertainment industry.
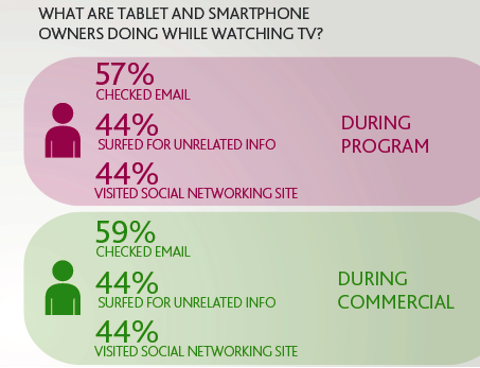
Nielsen's study revealed that owners of mobile devices are increasingly multi-tasking while watching a TV program. While the majority of people check their email, a significant 44% also visit social sites.
Get World-Class Marketing Training — All Year Long!
Are you facing doubt, uncertainty, or overwhelm? The Social Media Marketing Society can help.
Each month, you’ll receive training from trusted marketing experts, covering everything from AI to organic social marketing. When you join, you’ll also get immediate access to:
- A library of 100+ marketing trainings
- A community of like-minded marketers
- Monthly online community meetups
- Relevant news and trends updates
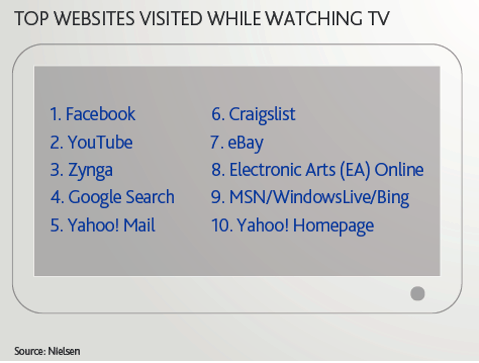
The top two sites visited while watching TV are the social sites Facebook and YouTube. This paints an interesting picture of people watching YouTube videos while also watching a TV program. It suggests that people want to be engaged.
What if your brand could engage people in conversations about popular TV shows, movies or sporting events while they are watching it? What if your brand became a trusted thought leader on a hot cultural topic?
I'd like to introduce you to someone who did just that. While he stumbled upon this, maybe you could proactively learn from his experience.
Case Study
Meet Cliff Ravenscraft, also known as the Podcast Answer Man. In 2006, Cliff decided to start a podcast about the TV show Lost. He did this as a personal hobby, but quickly discovered the enormous social power of podcasting when he had over 15,000 subscribers after his third episode.

Cliff has learned to match his personal interests in technology, television, books and faith with things that attract his growing audience.
For instance, he started a podcast on the popular young-adult books series, The Hunger Games, which has grown an audience of over 15,000 subscribers. He expects that number to double or triple after the movie is released in late March 2012.
Now that he has built a massive audience listening to his more than 20 weekly podcasts, he can promote the products and services he has for sale. Some of his audience members make purchases, but most keep coming back just because they care about the content he is sharing.
What if you could build a massive audience by tapping into the things you and your target audience both care about? That's what can happen as you become a student of culture and your audience's preferences and interests.
TIP: Your employees and friends may be some of your best research assistants in this quest.
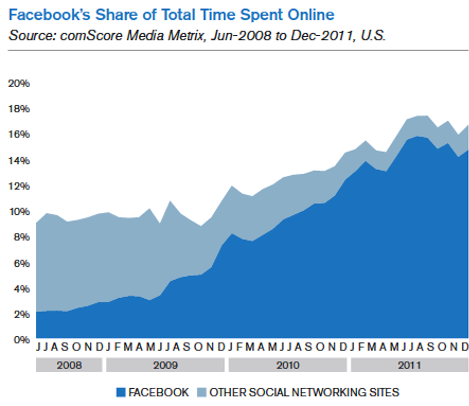
#3: Focus on Facebook—It's Where Consumers Spend Most of Their Online Social Time
We've known Facebook is the biggest social media site in terms of monthly active users (last published as 845 million). But comScore's study shows Facebook dominates in two other ways.
First, Facebook is the premier player among all web properties in terms of time spent—and that means engagement.
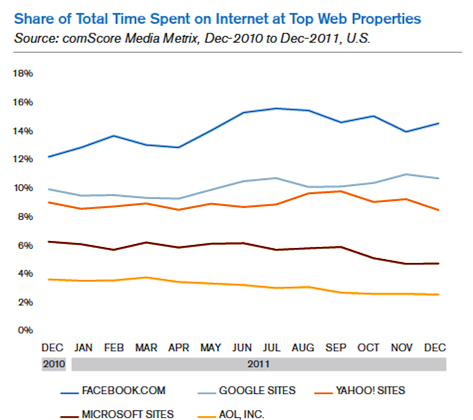
Second, when compared with other social media platforms, Facebook has achieved an even more impressive percentage of mindshare. Facebook captures 14.6% of Internet users' time compared to a combined 2% for all other social networking sites. Facebook also captures 16% of all page views.

Discover Proven Marketing Strategies and Tips
Want to go even deeper with your marketing? Check out the Social Media Marketing Podcast! Publishing weekly since 2012, the Social Media Marketing Podcast helps you navigate the constantly changing marketing jungle, with expert interviews from marketing pros.
But don’t let the name fool you. This show is about a lot more than just social media marketing. With over 600 episodes and millions of downloads each year, this show has been a trusted source for marketers for well over a decade.
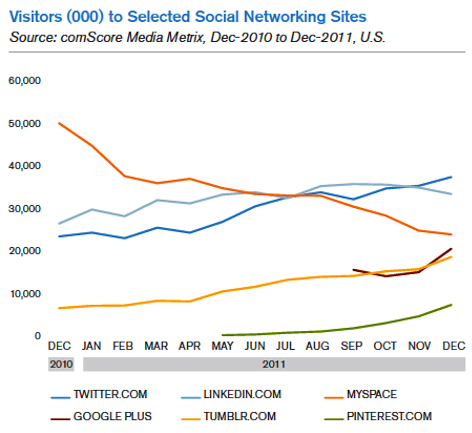
The rise of Twitter and LinkedIn as the second and third most visited social networking sites is evidenced by another comScore graphic. Equally revealing are the rapid decline of MySpace and the ascendance of Google+ and Pinterest. (It should be noted that social sites like Twitter and Google+ likely get significant engagement through mobile devices, third-party apps and other forms of content.)
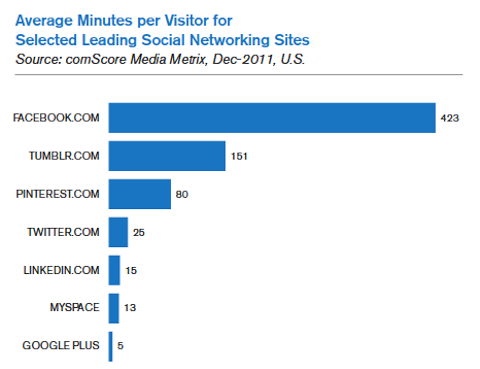
To highlight the engagement issue even more, comScore shows how Facebook keeps the average user onsite for 7 hours each month. Tumblr and Pinterest have also successfully engaged their users by keeping them onsite for more than an hour each.
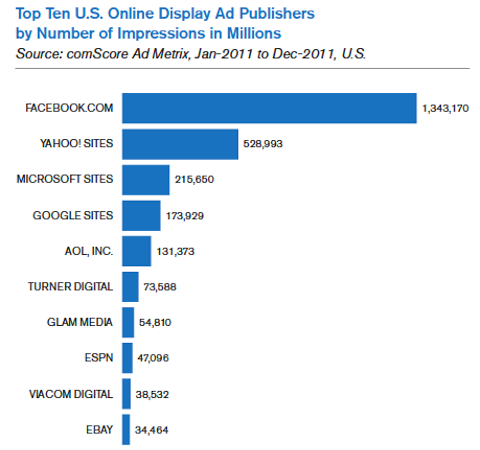
A final sign that Facebook is getting more eyeballs comes through comScore's findings about display advertising.
Key Lessons:
- If your goal is to engage your customers through social networks, you would be wise to invest in Facebook (and keep your eye on Pinterest, and maybe Tumblr, depending on your demographic);
- Even though Facebook's engagement numbers are impressive, if your customers are spending their time on LinkedIn or Twitter, that's where you should be;
- If you're buying online ads, consider the power of Facebook's display network. If you're looking for ideas on how to increase engagement on Facebook, check out this Facebook article by Jim Belosic.
#4: It's Time to Take Video Seriously
Americans are watching increasing numbers of videos online. According to comScore, this number has jumped over 43% to 100 million daily views (that's roughly one-third of the U.S. population watching a video online each day).
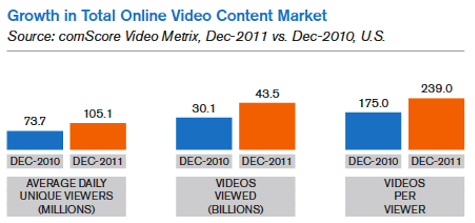
Of the 43.5 billion videos viewed in December 2011, over half of those were on Google properties (21.9 billion), primarily YouTube.
With the advent of long-form video content online through vendors like Netflix and Hulu, there's been an increase in how long users will watch a video from 5 minutes to nearly 6 minutes. This may open the door for marketers looking to produce edutainment videos (combining education and entertainment to produce engaging videos that keep people watching).
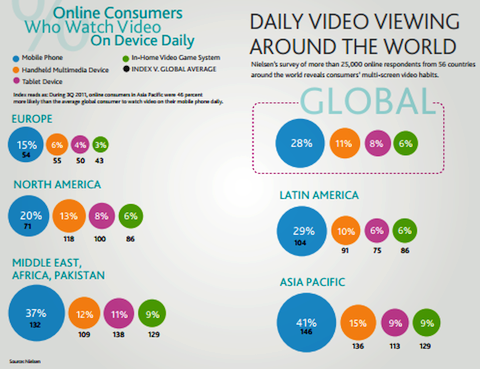
The way people watch videos is changing with the advent of mobile phones, notebooks and gaming systems. These differences are especially pronounced in Asia, Latin America and the Middle East.
For example, Nielsen found that someone from the Asia/Pacific region is more than twice as likely to watch a video on a mobile device as a North American. However, a European is half as likely to watch on a mobile device as the average global consumer.
Learn From the Best
Many companies are using video channels well, but many small- and medium-sized businesses have yet to embrace this powerful platform.
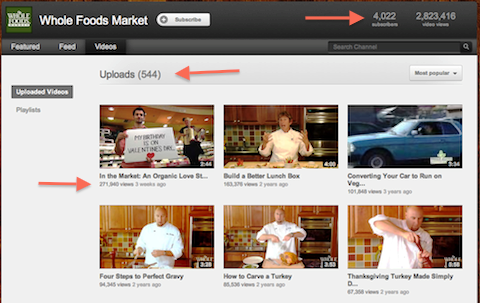
I like what Whole Foods has done by creating over 500 videos that have been seen by over 2.8 million people. They provide a wide variety of videos including how-to's and a funny organic love story series. None of these require professional videography skills. All you need is just a bit of training on how to use YouTube to drive traffic to your website.
#5: Consider the Role of Mobile
PQ Media found that 100 million U.S. users access the Internet through smartphones, with 60% of those being business end-users. comScore determined that 8% of all Internet traffic comes from mobile devices.
The time spent on social networks through mobile devices is relatively low (around 5%), but the numbers are still significant. For example, Facebook found that 423 million unique visitors accessed their site in December 2011 through mobile devices.
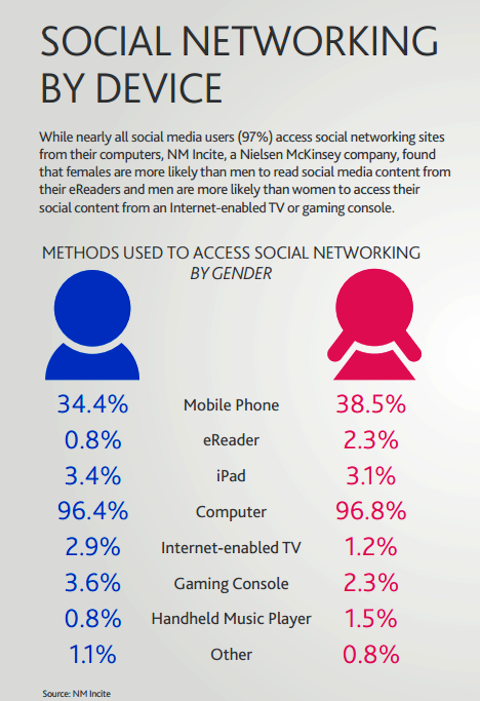
Nielsen compared how men and women differ in how they access social networking sites. Aside from the obvious choice of computers, mobile phones take second place with women being 10% more likely to access social sites on their phones.
Mobile devices are changing the landscape of retail sales. Shoppers can compare prices, read reviews and get real-time opinions from their friends through social media channels all while on their smartphones. Smart marketers will take this into account when creating content and finding ways to engage customers.
Key Lessons:
- Be sure your website is mobile-optimized;
- Create content that is easy to consume and respond to via mobile devices (shorter responses are better);
- If your audience is business-oriented or located in the Asia/Pacific region, make sure to develop a mobile strategy.
Now it's Your Turn
What do you think? How does this research inform or inspire your social media plans for the next quarter? Leave your questions and comments in the box below.
Attention Agency Owners, Brand Marketers, and Consultants

Introducing the Marketing Agency Show–our newest podcast designed to explore the struggles of agency marketers.
Join show host and agency owner, Brooke Sellas, as she interviews agency marketers and digs deep into their biggest challenges. Explore topics like navigating rough economic times, leveraging AI, service diversification, client acquisition, and much more.
Just pull up your favorite podcast app, search for Marketing Agency Show and start listening. Or click the button below for more information.
